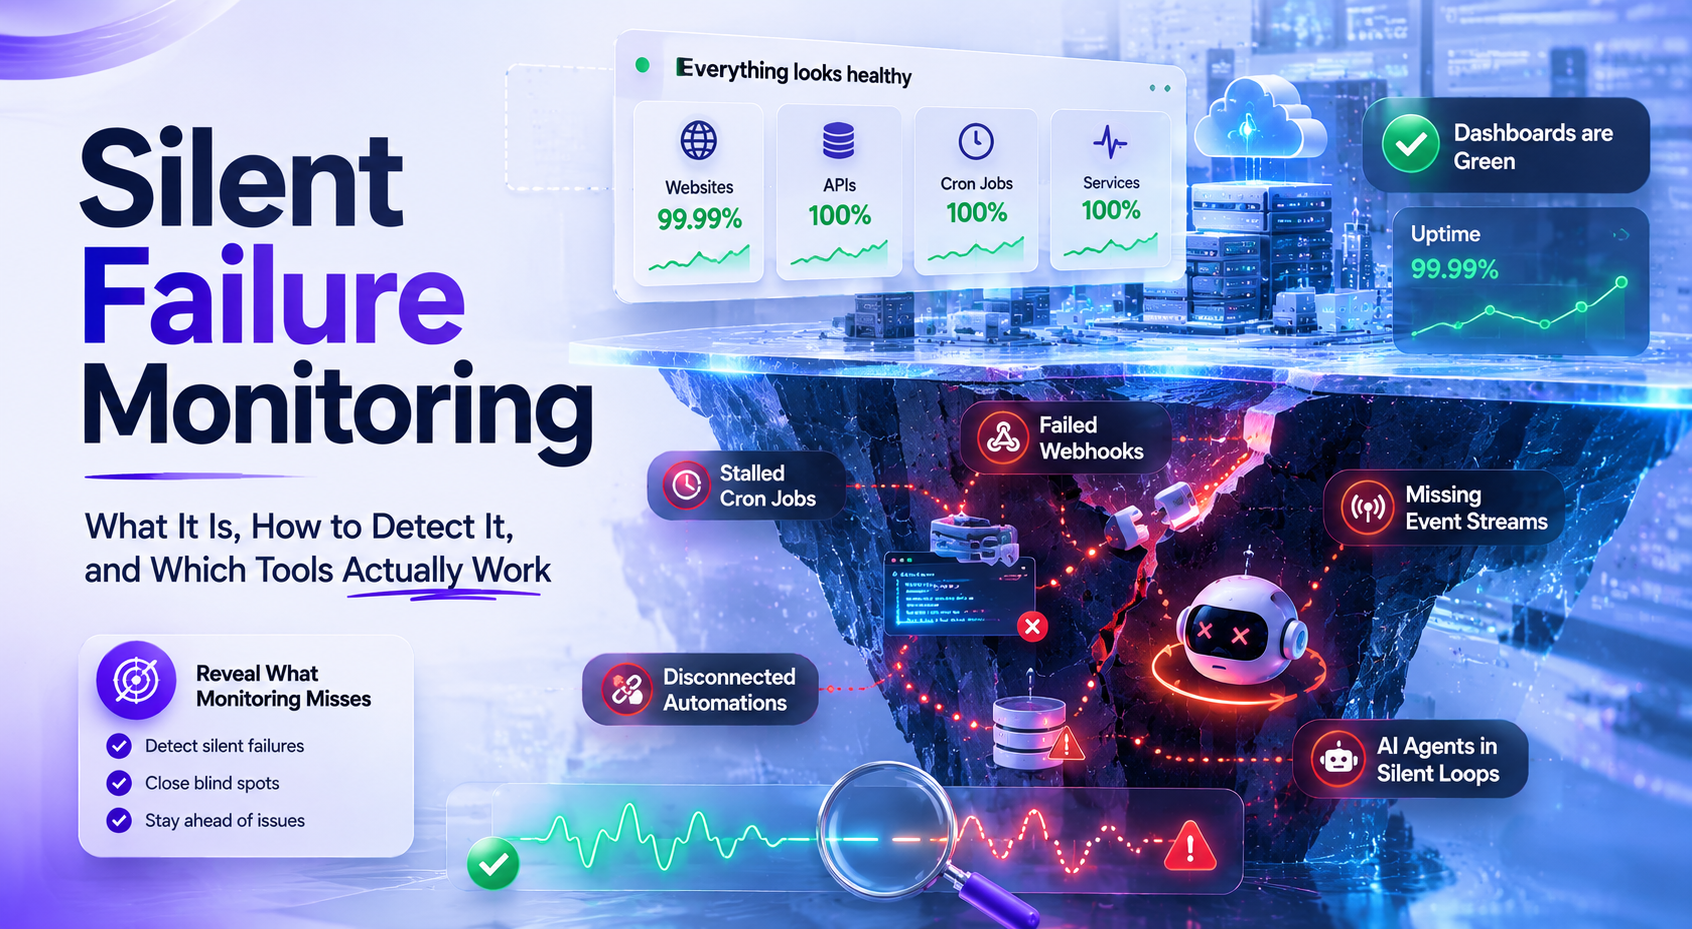
Silent Failure Monitoring: What It Is, How to Detect It, and Which Tools Actually Work
Silent failures don't throw exceptions. They don't create incidents. They just quietly cost you money until someone notices. This is the complete guide to understanding, detecting, and monitoring every type of silent failure in production.
Your server is up. Your error rate is clean. Your uptime monitor is green.
And your business has been quietly bleeding for six hours.
This is a silent failure — and it's the most common, most expensive, and most misunderstood class of production problem in modern software.
This guide covers everything: what silent failures are, why they're different from regular outages, the six types that cost teams the most, the detection method for each, and an honest comparison of every tool that claims to catch them.
What Is a Silent Failure?
A silent failure is a system malfunction that produces no visible error signal. No exception. No 500 response. No alert. No log entry that stands out. The system continues operating — technically — while something important has stopped working correctly.
The defining characteristic: conventional monitoring sees nothing.
Silent failures are invisible because conventional monitoring was built around a reactive model:
Something bad happens → error signal emitted → alert fires
Silent failures break this model. They're not things going wrong. They're things stopping going right. And that requires a completely different monitoring approach.
Silent Failure vs Downtime
People conflate silent failures with downtime. They're fundamentally different:
| Downtime | Silent Failure | |
|---|---|---|
| What happens | System stops responding | System keeps responding, doing nothing useful |
| Error signal | Immediate — 500s, timeouts, alerts | None — everything looks healthy |
| Detection | Uptime monitor catches it | Uptime monitor sees nothing |
| Discovery | Minutes (monitoring) | Hours or days (customer complaint) |
| Example | Server crashed | Webhook stopped delivering, server still up |
| Cost | Bounded — fixed when detected | Compounds — grows every hour undetected |
Downtime is loud. Silent failure is quiet. That's what makes it dangerous.
Why Silent Failures Are So Expensive
Three properties make silent failures uniquely damaging:
They compound over time. A server outage is fixed in minutes. A silent failure accumulates damage for every minute it goes undetected. A broken payment webhook that runs undetected for 6 hours isn't a 6-hour problem — it's hundreds of unactivated accounts, potential chargebacks, and trust damage that takes months to repair.
Nobody is watching for them. Regular failures produce noise. Someone hears it. Silent failures produce nothing. The first signal is usually a customer email, a support ticket, or someone manually checking analytics and noticing something off. By then, the damage is done.
They're hard to diagnose after the fact. When you discover a silent failure that's been running for 54 hours, you have to reconstruct what failed, when exactly, how many customers were affected, and which transactions need manual reconciliation. The forensic work is often more expensive than the technical fix.
The 6 Types of Silent Failure
Type 1 — Silence Failures
What it is: Expected events stop arriving entirely. No new signups. No Stripe payments. No orders. No webhook events.
Why conventional monitoring misses it: Uptime monitors check if your server responds. It does. Error monitors watch for exceptions. There are none. The absence of expected events is invisible to both.
Real examples:
- Signup flow broke at 2am — no new users for 6 hours, server returning 200 on every request
- Stripe webhook endpoint URL changed in a deploy — no payment events processed for 4 hours
- Shopify order webhook stopped delivering during peak Saturday trading — 47 minutes, no orders
Detection method: Smart Silence Detection — ML learns your normal event frequency including time-of-day and day-of-week patterns. Alerts when the silence is genuinely anomalous. No manual threshold to configure.
Type 2 — Broken Flow Failures
What it is: A multi-step process starts but never finishes. The first event fires — the second never comes.
Why conventional monitoring misses it: Each individual step looks healthy. No step throws an error. The absence of a completion event is invisible unless you're explicitly watching for the pair.
Real examples:
payment.initiatedfires —payment.completednever arrives. Customer charged, account not activateduser.registeredfires —email.verifiednever arrives. User churned before activatingorder.placedfires —order.fulfillednever arrives. Customer waiting, fulfilment never triggeredjob.startedfires —job.completednever arrives. Job crashed halfway, nobody knows
Detection method: Broken flow detection — tracks run.start() → run.complete() pairs via the NotiLens SDK. If a flow starts but never completes within the ML-learned baseline window, alert fires.
Type 3 — Cron Output Failures
What it is: A scheduled job runs successfully — exit code 0, no errors — but does nothing useful. Zero records processed. Zero emails sent. Zero rows updated.
Why conventional monitoring misses it: Heartbeat monitors (Healthchecks.io, Cronitor) know the ping arrived. They have no awareness of what the job actually did. A job that processes zero records looks identical to a healthy run.
Real examples:
- Nightly invoice generation job: ran at midnight, processed 0 invoices, exited clean. Customers not billed
- Daily data sync: ran successfully, processed 0 records. Data warehouse stale for 3 days
- Email digest job: completed successfully, sent 0 emails. User engagement collapsed, nobody noticed
Detection method: SDK task lifecycle with run.metric("records_processed", n) — NotiLens ML learns your job's normal output volume and alerts when it's anomalously low. See cron job monitoring guide.
Type 4 — Metric Drift Failures
What it is: A metric gradually shifts outside its normal range over days or weeks. No single observation is alarming. The cumulative shift is.
Why conventional monitoring misses it: Fixed thresholds fire on threshold crossings. Gradual drift never crosses the threshold — it just keeps climbing. Alert fatigue from tight thresholds means teams set thresholds wide, which drift easily hides within.
Real examples:
- API response time creeping from 120ms to 800ms over 2 weeks — never crossed the 2-second alert threshold
- Conversion rate slowly declining from 4.2% to 2.1% over a month — each day's change indistinguishable from noise
- Background job runtime growing from 4 minutes to 47 minutes over a week — no alert fired because no timeout was set
Detection method: ML anomaly detection — learns your metric's normal baseline including trend and variance. Metric drift detection (new in May 2026) specifically catches gradual shifts over extended periods.
Type 5 — AI Agent Silent Failures
What it is: An AI agent runs — consuming compute and tokens — while producing nothing useful. Three sub-types: ghost runs (completes with wrong/empty output), infinite loops (keeps running without completing), and stalls (alive, not progressing).
Why conventional monitoring misses it: The agent process is running. API calls are completing at normal latency. No exception is thrown. The difference between a healthy agent and a looping one is invisible to every infrastructure monitoring tool.
Real examples:
- Research agent called
web_search47 times without completing. Token cost: $4.80. Output: nothing - Agent stalled waiting for an external API that rate-limited. Ran for 4 hours. Delivered nothing
- Ghost run: agent completed, output existed, output was wrong. Downstream processes inherited bad state
Detection method: AI agent monitoring — run.loop() called on every iteration lets NotiLens ML detect when a run has significantly more iterations than baseline. run.wait() catches stalls. run.output_generated() + run.complete() pair catches ghost runs.
Type 6 — Integration and Automation Failures
What it is: No-code workflows — Zapier zaps, Make scenarios, n8n workflows — stop running or fail silently. The platform logs the failure internally. Nobody is watching.
Why conventional monitoring misses it: These tools run in the background, fail in the background, and alert only through their own notification systems — which most teams never configure properly.
Real examples:
- Lead follow-up Zapier zap paused after auth token expiry — 300 leads not followed up for 3 days
- Invoice generation Make scenario disabled after repeated errors — invoices not sent for 2 billing cycles
- n8n data warehouse sync stopped — dashboards showed stale data, decisions made on wrong numbers
Detection method: Start + completion pings in every critical workflow. Automation monitoring guide — run.start() at the top of every workflow, run.complete() at the end. Smart Silence Detection catches workflows that stop running entirely.
The Detection Framework: One Method Per Failure Type
| Failure type | What to watch | Detection method | NotiLens feature |
|---|---|---|---|
| Silence | Expected events stop arriving | ML baseline learning | Smart Silence Detection |
| Broken flow | Start event without completion | Start → complete pairing | Broken flow detection |
| Cron output | Job ran, did nothing | Records processed metric | run.metric() + ML anomaly |
| Metric drift | Gradual baseline shift | Trend-aware anomaly detection | Metric drift detection |
| AI agent | Loop, stall, ghost run | Iteration count + output confirmation | run.loop() + run.output_generated() |
| Automation | Workflow stopped running | Ping-based + silence detection | Smart Silence Detection |
Why Most Monitoring Tools Miss Silent Failures
Every conventional monitoring tool was built around a reactive model. They watch for something going wrong. Silent failures are defined by the absence of something going right. Here's the gap per tool category:
Uptime monitors (UptimeRobot, Uptime Kuma, Pingdom) — check if your URL returns a 200. A broken signup flow that returns 200 while silently dropping all registrations is invisible. Full comparison →
Error trackers (Sentry, Bugsnag) — capture unhandled exceptions. Silent failures by definition produce no exception. Sentry fires when something breaks. It has no concept of something that should be happening stopping. Full comparison →
Cron monitors (Healthchecks.io, Cronitor) — expect a ping at a defined interval. Know if the job ran. Don't know if it did anything. A zero-record run looks identical to a healthy run. Detailed comparison →
APM tools (Datadog, New Relic) — watch infrastructure metrics. Partial anomaly detection on metric streams, but no native concept of business-event silence, broken flows, or cron output quality. Full comparison →
Incident management (PagerDuty, Incident.io) — route alerts that other tools detect. If no tool detects the silent failure, nothing reaches PagerDuty. They're routing layers, not detection layers. Full comparison →
How NotiLens Detects Silent Failures
NotiLens was built specifically around the silent failure problem — watching whether your business is actually working, not just whether your server is responding.
Smart Silence Detection
ML learns your normal event frequency — how often signups arrive, how frequently payments flow, when cron jobs complete — including time-of-day and day-of-week variation. Alerts when activity is genuinely abnormal for that specific time and context.
No manual threshold to configure. No false alerts for naturally quiet Sunday nights. No missed detections because Friday afternoon traffic looks different from Monday morning.
import notilens

nl  = notilens.init(name="payments")
run = nl.task("payment-flow")

run.start()
# ... payment processing logic ...
run.complete("Payment processed")

# Smart Silence Detection alerts if payment events stop arriving
# ML handles the baseline — no threshold configuration needed
Broken Flow Detection
The SDK run.start() → run.complete() pair tracks every flow instance. If start fires but complete never arrives within the ML-learned baseline window — broken flow alert fires.
# In your payment handler
run = nl.task("payment")
run.start()                    # payment.initiated equivalent

process_payment(payment_id)

run.complete("Payment done")   # payment.completed equivalent
# If complete never fires — broken flow detected, alert fires
Cron Output Quality
Track what the job actually did — not just that it ran:
run = nl.task("invoice-sync")
run.start()

records = sync_invoices()

run.metric("records_processed", len(records))  # ML learns normal volume
run.metric("runtime_seconds",   elapsed)        # ML learns normal duration
run.complete(f"Synced {len(records)} invoices")

# If records_processed = 0 when baseline is 300 — anomaly alert fires
# If runtime = 47min when baseline is 4min — anomaly alert fires
AI Agent Monitoring
run.loop() on every iteration. run.output_generated() before completion. ML detects when the pattern is anomalous:
run = nl.task("research-agent")
run.start()

for i, step in enumerate(agent_steps):
    run.loop(f"[{i+1}] {step.tool}")   # called every iteration
    run.metric("tool_calls", 1)
    run.metric("tokens", step.tokens)

    result = execute(step)

run.output_generated("Research complete")
run.complete("Done")

# If run.loop fires 40x when baseline is 3-5 — loop detected, alert fires
# If run.output_generated never fires before complete — ghost run detected
The Full SDK Reference
run.start()              # flow/task begins
run.progress("msg")      # meaningful checkpoint
run.loop("msg")          # agent iteration
run.metric("key", val)   # track output quality
run.wait("msg")          # pausing on external resource
run.output_generated()   # useful output confirmed
run.complete("msg")      # successful completion
run.error("msg")         # non-fatal error (continues)
run.fail("msg")          # fatal failure
run.timeout("msg")       # SLA exceeded
The Silent Failure Audit — Run This on Your Stack Today
For each question, a "no" is a silent failure waiting to happen:
Silence detection:
- Do you know if your Stripe webhooks stopped delivering in the last 24 hours?
- Do you know if your signup flow converted anyone today?
- Do you get alerted if no orders arrive during peak hours?
- Do you know if your most critical API endpoint received traffic today?
Broken flow detection:
- Do you know if any payment initiated today but never completed?
- Do you know if any user registered but never received a confirmation email?
- Do you know if any order placed today wasn't sent to fulfilment?
Cron output quality:
- Do you know how many records your nightly sync processed last night?
- Do you know if your billing job processed any invoices this month?
- Do you know if your cleanup job actually cleaned anything?
AI agents:
- Do you know if any agent tasks started today but never completed?
- Do you know how many tokens your agents consumed today vs your normal baseline?
- Do you know if any agent is currently looping?
Automations:
- Do you know if all your Zapier zaps are currently active?
- Do you know if your n8n workflows ran successfully in the last 24 hours?
If you answered "no" to more than three — you have silent failures that are either happening now or will happen soon without you knowing.
Setting Up Silent Failure Monitoring: Week by Week
Don't try to instrument everything at once. Start with what touches revenue:
Week 1 — Revenue protection:
- Stripe webhook silence alert (Smart Silence Detection on payment events)
- Payment flow broken flow detection (
run.start()+run.complete()) - Shopify order silence alert (if applicable)
Week 2 — Business health:
- Signup silence alert
- Billing / invoice cron job output quality (
run.metric("records_processed", n)) - Server uptime (any uptime monitor)
Week 3 — Operations:
- API error rate monitoring
- Data sync cron job output quality
- Automation workflow pings (Zapier / n8n / Make)
Week 4+ — AI and advanced:
- AI agent task lifecycle (
run.loop(),run.output_generated()) - Token consumption anomaly detection
- Multi-agent pipeline broken flow detection
For the complete setup guide see The Founder's Monitoring Stack.
Summary
Silent failures are the most expensive class of production problem because they're invisible to every conventional monitoring tool — uptime monitors, error trackers, APM tools, cron monitors, and incident management platforms all miss them by design.
Detecting them requires a monitoring model built around a different question: not "did something break?" but "is everything that should be happening, actually happening?"
The six types — silence failures, broken flows, cron output failures, metric drift, AI agent failures, and automation failures — each require a specific detection method. NotiLens covers all six: Smart Silence Detection, broken flow tracking, output quality metrics via the SDK, ML anomaly detection and drift detection, and AI agent lifecycle monitoring.
One caught silent failure — a payment webhook gap, a broken signup flow, a zero-record sync — pays for months of monitoring.
Try NotiLens free for 7 days — no credit card required.
Related Reading
- What is a silence alert?
- What is a broken flow alert?
- What is ML anomaly detection?
- Silent failure: why your system looks fine while your business is breaking
- The ROI of knowing in 60 seconds vs 6 hours
- Cron job monitoring: why uptime checks aren't enough
- Stripe webhook monitoring: the silent failure no one talks about
- AI agents in production: silent failures, ghost runs, and how to catch both
- How to detect infinite loops in AI agents
- Silent failure monitoring tools in 2026
- Best silent failure monitoring tools: Healthchecks.io vs Cronitor vs Better Stack vs UptimeRobot vs Uptime Kuma vs NotiLens
- The Founder's Monitoring Stack
Frequently Asked Questions
What is the difference between a silent failure and a bug? All silent failures are bugs, but not all bugs are silent failures. A bug that crashes your server is loud — it alerts immediately. A silent failure is a specific class of bug where the system continues operating normally from a monitoring perspective while something important has stopped working. The defining characteristic is the absence of any error signal.
Can uptime monitors detect silent failures? Uptime monitors detect a narrow class of silent failure — server completely down, URL returning an error. They miss the most expensive silent failures: broken business flows, events that stopped arriving, cron jobs that ran and did nothing, AI agents that looped instead of completing. See the full tool comparison for what each tool catches.
How long does it typically take to discover a silent failure without monitoring? Based on engineering post-mortems, the median discovery time for a silent failure without targeted monitoring is 6–18 hours. The first signal is almost always a customer complaint or a manual analytics check — not an automated alert. With silence alerts and broken flow detection, discovery time drops to minutes.
What's the minimum setup to catch the most important silent failures?
Three things cover 80% of the most expensive silent failures: (1) Smart Silence Detection on your payment and signup events, (2) broken flow detection on your payment flow, (3) run.metric("records_processed", n) on your most critical cron job. Setup time: under 30 minutes.
Is silent failure monitoring the same as observability? Observability (Datadog, Grafana, New Relic) gives you deep visibility into what your system is doing — traces, logs, metrics. Silent failure monitoring watches whether your business is working — whether expected events are arriving, whether flows are completing, whether jobs are producing output. Observability catches what's happening. Silent failure monitoring catches what's not happening. Both are necessary; they solve different problems.