What's the ROI of Knowing in 60 Seconds vs 6 Hours?
The detection gap is where silent failures compound — and most monitoring stacks have no answer for it. Here's the calculation nobody runs, and why detection time matters more than fix time.
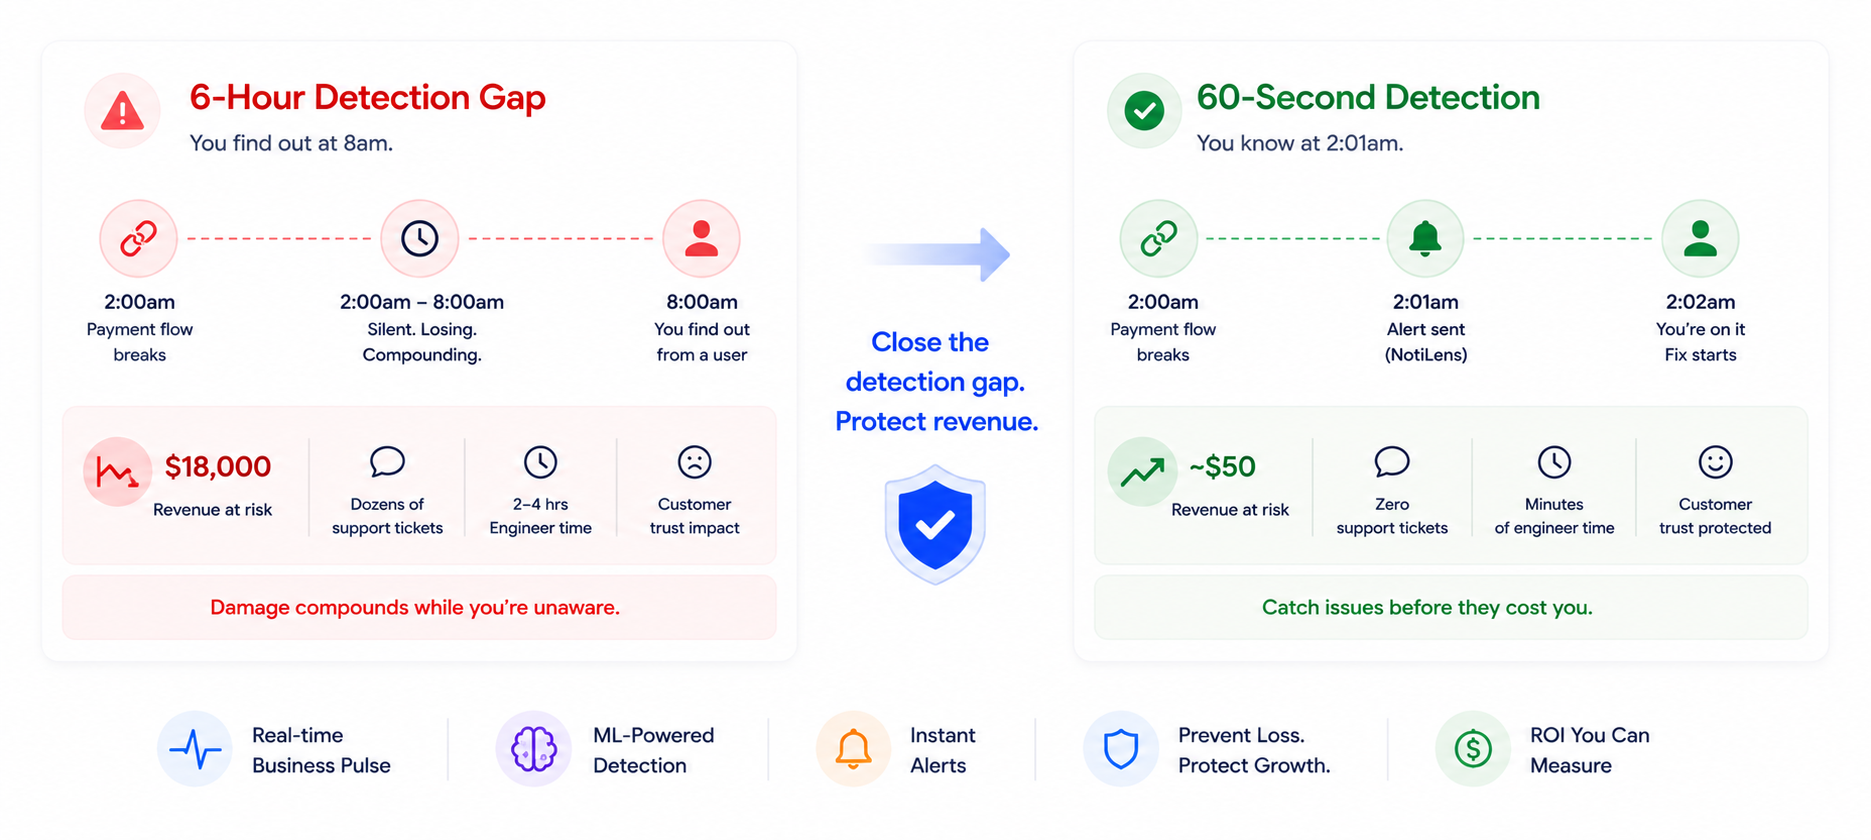
Your payment flow breaks at 2am. Webhooks stop delivering. Orders appear to process. Nothing errors. Nothing alerts.
You find out at 8am when a user messages you.
That's a 6-hour detection gap.
$150 average order value. 20 orders per hour. That's $18,000 sitting in that gap. Some will retry. Some won't. Some customers will never come back.
And that's before support tickets, refund processing time, trust damage, and engineer hours spent reconstructing what happened from logs that weren't designed to answer that question.
Six hours of not knowing is never just six hours.
The Calculation Nobody Runs
Engineering teams track MTTR obsessively — mean time to resolution. How fast did we patch it, how clean was the rollback, how good was the postmortem.
Mean time to detection gets almost no attention. But it's where cost compounds.
The fix is always bounded. An engineer picks it up, patches it, deploys. Hours at most.
The detection gap is unbounded. It ends when someone happens to check the right screen, a user complains, or the end-of-day report looks wrong.
Shrinking detection time from 6 hours to 60 seconds doesn't change how fast you fix things. It changes how much damage there is to fix when you start.
The Monitoring Layer Your Stack Is Missing
Every tool in your observability stack was built to watch infrastructure. Servers, APIs, error rates, response times. All of it answers one question: is the system up?
Nobody built the layer that answers: is the business working?
Those are different questions with completely different answers.
Your system can be completely up while your signup flow is broken. Your API can respond in 120ms while your nightly sync processes zero records. Your error rate can be clean while your AI agent loops 47 times producing nothing.
Infrastructure monitoring has no vocabulary for these failures. They don't throw errors. They don't trigger alerts. They just quietly cost you money until someone notices.
What Silent Failures Actually Look Like in Production
These are the failures that don't show up in dashboards but show up in revenue:
Silence failures
No new signup in 4 hours on a Wednesday when your baseline is 12 per hour. No new order in 3 hours on a Friday afternoon. An expected heartbeat from a downstream service that stopped arriving.
Broken flow failures
payment.initiated that never reaches payment.completed. Signup started, email confirmation never sent. Checkout begun, order never confirmed. The first event arrives — the second never does.
Cron failures
Not just whether the job ran — but whether it did anything. A nightly invoice sync that ran at midnight, processed 0 records, exited clean, no error thrown. A job that ran and touched nothing looks identical to a healthy run unless you're tracking records processed, time taken, and exit state together.
AI agent failures
Agents fail differently from regular software. They don't crash — they drift, loop, stall, and consume resources while producing nothing. An agent that looped 47 times, burned through its token budget, and produced nothing won't show up in your error rate. It shows up in your OpenAI bill and your missing output.
How NotiLens Closes the Detection Gap
NotiLens is business pulse monitoring — a layer that sits above your infrastructure and watches whether your business is actually healthy.
It learns your baseline automatically. Your Wednesday signup rate. Your typical payment flow completion time. Your agent's normal run count. Your cron's expected record volume. No thresholds to configure. No YAML to write.
When reality diverges from baseline — you get the alert. Not a user. Not a tweet. You.
Silence detection — fires when expected events stop arriving. Payments, signups, orders, heartbeats. Weekday and time-of-day aware so quiet Saturday nights don't trigger false alerts.
Broken flow detection — payment.initiated should reach payment.completed within the expected window. If it doesn't, that's the alert.
Cron job monitoring — your job pings NotiLens when it starts and completes, passing records processed, time taken, and any metadata you want tracked. Zero records on a job that normally touches 300 — that's the alert. Job that didn't start at all — that's also the alert.
AI agent observability — loops, hangs, token budget hits, human approval waits. All of it in one feed. Connects natively via MCP server for Claude, GPT, and any LLM agent — no SDK setup required.
The Math, Run Properly
| Without NotiLens | With NotiLens | |
|---|---|---|
| Detection time | 6 hours | ~60 seconds |
| Orders in gap (20/hr × $150) | $18,000 at risk | $50 at risk |
| Support tickets generated | Dozens | Zero |
| Engineer hours reconstructing | 2–4 hours | 0 |
| Customer trust damage | Hard to quantify | Avoided |
One caught payment failure covers months of NotiLens. Most teams catch several per month once they're actually watching for them.
Setup
Connects to Stripe, Shopify, GitHub, servers, AI agents, n8n, Zapier, Make — or anything via webhook or SDK in Python, Node.js, Go, Rust, Ruby, PHP, and Java.
First alert in under 5 minutes.
For the full monitoring stack and week-by-week setup order, see The Founder's Monitoring Stack.
Try NotiLens free for 7 days — no credit card required.