Automation Monitoring: How to Detect n8n, Make, and Zapier Workflow Failures Before They Cost You
Automation workflows fail silently. A broken Zapier zap, a stalled n8n workflow, or a Make scenario that stopped running three days ago — none of these show up in your uptime monitor. Here's how to catch them.
Your automation workflows run in the background. That's the point — they handle the repetitive tasks so you don't have to think about them.
The problem is they also fail in the background. Silently. Without telling anyone.
A Zapier zap that stopped running three days ago. An n8n workflow that's erroring on every execution. A Make scenario that was supposed to send 500 emails — and sent zero. All of this is invisible until someone notices the downstream effect: leads not followed up, invoices not sent, data not synced, customers not onboarded.
This guide covers how automation workflows fail, what to monitor, and how to get alerted the moment something breaks — without waiting for someone to notice.
How Automation Workflows Fail Silently
Each platform has its own failure modes — but the pattern is the same: the workflow fails, the platform logs it somewhere, and nobody knows.
Zapier
Authentication expiry — Zapier connections use OAuth tokens. When a connected app token expires or is revoked, Zapier marks the zap as having an error and stops running it. The app dashboard shows a red warning. Nobody is watching the dashboard.
Zap turned off after errors — Zapier automatically pauses zaps after a certain number of consecutive errors. The workflow stops entirely. You get an email — which goes to whichever address is on the account, which may not be monitored, which may be in spam.
Partial execution — a zap runs its first step but fails partway through. The trigger fires, the action doesn't. Zapier logs the failed task. No alert unless you've configured error notifications, which most accounts haven't.
Task limit hit — on lower Zapier plans, you have a monthly task limit. When it's hit, zaps stop running silently until the billing cycle resets.
Make (formerly Integromat)
Scenario execution errors — Make logs errors per execution but doesn't alert by default. You have to check the execution history manually to see failures.
Data store limits — Make data stores have size limits. When they're full, scenarios that write to them fail silently.
Module timeout — a module that calls an external API can timeout. Make retries a configured number of times, then marks the execution as failed. No push notification by default.
Scenario turned off — like Zapier, Make can disable scenarios after repeated failures. The scenario is off, automations stop, nothing obvious tells you.
Webhook queue backup — if a Make webhook receives more events than it can process, events queue up. If the queue overflows, events are dropped silently.
n8n
Node execution failures — an n8n node fails, the workflow stops at that node. The error is logged in n8n's execution history. No external alert unless you've explicitly wired one up.
Credential invalidation — API credentials used in n8n nodes expire or get revoked. The node fails silently on every execution.
Workflow disabled after errors — n8n can be configured to deactivate workflows on error. If this is on, a single bad execution disables your entire workflow.
Self-hosted n8n process crash — if you're self-hosting n8n, the process itself can crash. All scheduled workflows stop. Nothing external tells you — your uptime monitor might not even check the n8n port.
Memory exhaustion — large data processing workflows can exhaust available memory. The process dies mid-execution. The workflow appears active but produces no output.
What Silent Automation Failures Cost
Automation workflows handle business-critical tasks. When they fail silently, the cost isn't immediately obvious — it compounds over time.
Lead follow-up workflows — your CRM-to-email automation breaks. New leads stop receiving follow-up sequences. Your sales team assumes the pipeline is dry. It isn't — there are 200 uncontacted leads sitting in your CRM waiting for emails that never came.
Invoice generation — your billing automation stops. Invoices that should have gone out on the 1st of the month don't. You notice at the end of the month when MRR looks wrong. Chasing invoices manually is expensive and awkward for the customer relationship.
Data sync workflows — your n8n workflow that syncs your app database with your analytics warehouse stops running. Reports become stale. Business decisions get made on data that's days or weeks old.
Customer onboarding sequences — a new user signs up, your automation is supposed to trigger a welcome sequence, provision access, and notify your team. The automation is broken. The user gets nothing. They churn before they ever experienced your product.
Support ticket routing — your Zapier zap that routes support tickets to the right team member stops working. Tickets sit in a queue unassigned. Response times blow out. Customers escalate.
In each case, the automation failure wasn't the visible problem. The visible problem was the downstream consequence — unhappy customers, wrong business data, missed revenue — which arrived days after the actual failure.
The Three Layers of Automation Monitoring
Effective automation monitoring requires watching at three levels:
Layer 1 — Did the workflow run? Was the workflow triggered? Did it attempt to execute? This catches the "workflow disabled" and "trigger stopped firing" failure modes.
Layer 2 — Did the workflow complete? Did it execute all the way through without errors? This catches node failures, authentication errors, and partial executions.
Layer 3 — Did the workflow produce the right output? Did it actually do what it was supposed to? This catches silent wrong outputs — the workflow ran, it completed, but it sent the email to the wrong list, or wrote the wrong value, or routed the ticket incorrectly.
Most teams monitor none of these. The right setup monitors all three.
Setting Up Automation Monitoring With NotiLens
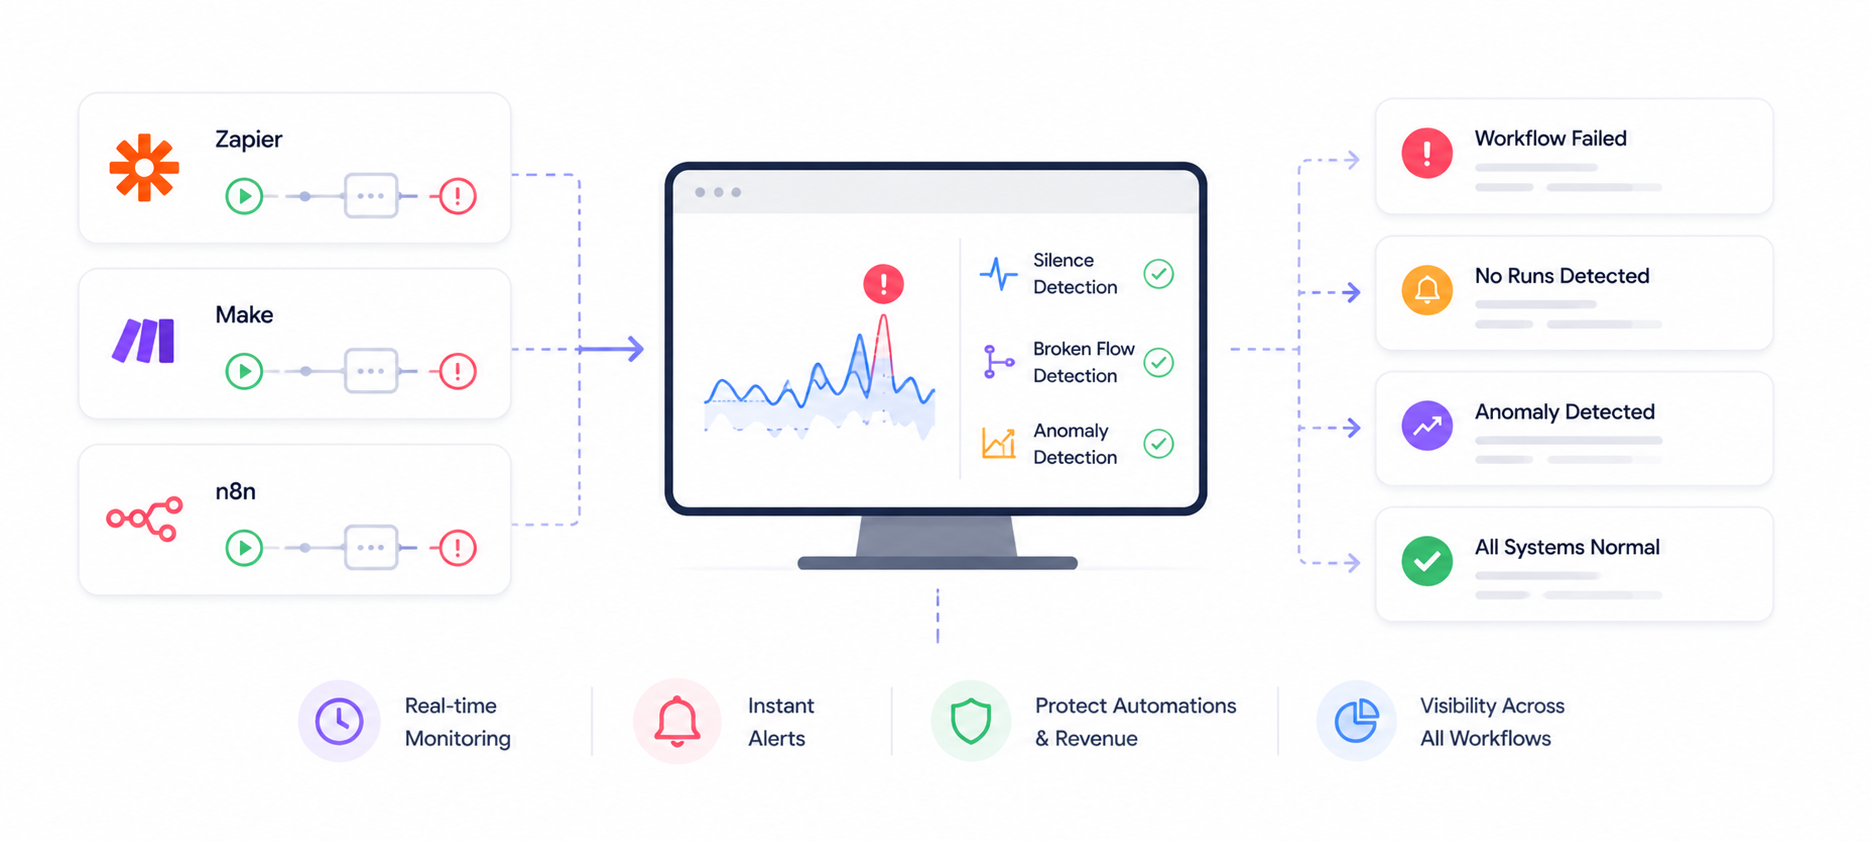
The key pattern for all three platforms is the same: add a NotiLens step at the start and end of your workflow. Start ping = workflow triggered. Completion ping = workflow finished successfully. If the start ping never comes, Smart Silence Detection catches it. If the start comes but the completion never does, broken flow detection catches it.
Install the NotiLens SDK
npm install @notilens/notilens   # Node.js / n8n
pip install notilens             # Python
Or use the NotiLens webhook URL directly in no-code platforms — no SDK required.
Monitoring Zapier Workflows
Zapier doesn't support custom code execution in most zaps, but it does support webhook actions. Add NotiLens pings as HTTP POST steps in your zap.
Step 1 — Add a "Workflow Started" ping at the top of your zap:
Add a Webhooks by Zapier → POST action as your first step:
- URL:
https://hook.notilens.com/webhook/YOUR_TOPIC_ID/send - Payload type:
json - Data:
{
  "event": "zap.started",
  "meta": {
    "zap_name": "Lead Follow-up Sequence",
    "trigger_id": "{{trigger_id}}"
  }
}
Step 2 — Add a "Workflow Completed" ping at the end of your zap:
Add another Webhooks by Zapier → POST action as your final step:
- URL:
https://hook.notilens.com/webhook/YOUR_TOPIC_ID/send - Data:
{
  "event": "zap.completed",
  "meta": {
    "zap_name": "Lead Follow-up Sequence",
    "trigger_id": "{{trigger_id}}"
  }
}
What this catches:
- Zap never triggered → Smart Silence Detection fires (no
zap.startedevents) - Zap triggered but failed partway through → Broken flow detection fires (
zap.startedwith nozap.completed) - Zap ran successfully → Both pings arrive, no alert
For Zapier's built-in error notifications: Go to Zap Settings → Error Notifications and add your email. This is Zapier's native alerting — combine it with NotiLens pings for belt-and-suspenders coverage.
Monitoring Make (formerly Integromat) Scenarios
Make supports HTTP modules, so you can add NotiLens pings directly in your scenario.
Step 1 — Add an HTTP module at the start of your scenario:
Add an HTTP → Make a request module as your first module:
- URL:
https://hook.notilens.com/webhook/YOUR_TOPIC_ID/send - Method:
POST - Body type:
Raw - Content type:
application/json - Request content:
{
  "event": "scenario.started",
  "meta": {
    "scenario_name": "Invoice Generation",
    "execution_id": "{{executionId}}"
  }
}
Step 2 — Add an HTTP module at the end of your scenario:
Add another HTTP → Make a request module as your final module:
- Request content:
{
  "event": "scenario.completed",
  "meta": {
    "scenario_name": "Invoice Generation",
    "execution_id": "{{executionId}}",
    "records_processed": "{{total_records}}"
  }
}
Step 3 — Add an error handler route:
In Make, right-click any module → Add error handler → Resume. Add an HTTP module in the error route:
{
  "event": "scenario.failed",
  "meta": {
    "scenario_name": "Invoice Generation",
    "execution_id": "{{executionId}}",
    "error": "{{error.message}}"
  }
}
What this catches:
- Scenario not running → Smart Silence Detection fires
- Scenario started but failed →
scenario.failedping fires an immediate alert - Scenario started but error handler didn't catch it → broken flow detection fires
Monitoring n8n Workflows
n8n supports HTTP Request nodes and code execution, giving you the most flexibility for monitoring.
Option 1 — HTTP Request nodes (no-code):
Add an HTTP Request node at the start and end of your workflow:
Start node configuration:
- Method:
POST - URL:
https://hook.notilens.com/webhook/YOUR_TOPIC_ID/send - Body (JSON):
{
  "event": "workflow.started",
  "meta": {
    "workflow_name": "Customer Onboarding",
    "execution_id": "={{ $execution.id }}"
  }
}
Completion node configuration:
{
  "event": "workflow.completed",
  "meta": {
    "workflow_name": "Customer Onboarding",
    "execution_id": "={{ $execution.id }}",
    "records_processed": "={{ $json.records_count }}"
  }
}
Option 2 — Code node with SDK (full control):
// n8n Code node — workflow started
import { NotiLens } from '@notilens/notilens';

const nl  = NotiLens.init('n8n-workflows');
const run = nl.task('customer-onboarding');

run.start();
run.track('workflow.started', 'Customer onboarding workflow triggered', {
  meta: { execution_id: $execution.id }
});

return items; // pass data through to next node
// n8n Code node — workflow completed (final node)
run.metric('records_processed', items.length);
run.complete(`Onboarded ${items.length} customers`);

return items;
Option 3 — n8n Error Workflow:
n8n supports a global error workflow that fires when any workflow fails. Set up a dedicated error workflow:
- Go to Settings → Error Workflow in n8n
- Create a new workflow with an HTTP Request node:
{
  "event": "workflow.failed",
  "meta": {
    "workflow_name": "={{ $json.workflow.name }}",
    "execution_id": "={{ $json.execution.id }}",
    "error": "={{ $json.execution.error.message }}",
    "node_failed": "={{ $json.execution.error.node.name }}"
  }
}
This global error handler catches failures from every workflow in your n8n instance — you don't need to add error handling to each workflow individually.
Smart Silence Detection for Automation Workflows
The most powerful monitoring for automation workflows is silence detection — knowing when a workflow that should have run didn't run at all.
Each platform has workflows that run on a schedule:
- Zapier: "every hour, sync new leads to CRM"
- Make: "every day at 9am, generate invoices"
- n8n: "every 30 minutes, sync data warehouse"
Smart Silence Detection learns how frequently your workflow pings NotiLens. If the expected pings stop arriving — because the workflow was disabled, the trigger stopped firing, or the platform itself had an issue — NotiLens alerts you.
No manual schedule to configure. The ML model learns your workflow's pattern automatically.
For Make scenarios with a fixed schedule, you can also set a manual silence window as a fallback:
- Daily invoice generation: alert if no
scenario.completedping in 26 hours - Hourly data sync: alert if no ping in 90 minutes
Both Smart Silence Detection and manual windows can be active simultaneously — Smart Silence Detection handles the pattern learning, the manual window acts as a hard backstop.
Automation Monitoring Checklist
Before you consider an automation workflow properly monitored:
- Start ping — HTTP POST to NotiLens at the beginning of every critical workflow
- Completion ping — HTTP POST to NotiLens at the successful end of every critical workflow
- Error ping — HTTP POST to NotiLens when the workflow fails (with error message)
- Smart Silence Detection active — NotiLens alerts if workflow stops running
- Broken flow detection — start without completion triggers an alert
- Metrics tracked — records processed, emails sent, rows synced
- On-call routing — critical workflow failures route to the right person
- Platform-level error notifications enabled (Zapier email, Make notifications)
- Tested — deliberately broke a workflow and confirmed NotiLens alerted
Which Workflows to Monitor First
Not all automations carry equal risk. Start with the ones where silent failure is most expensive:
| Workflow type | Failure cost | Monitor priority |
|---|---|---|
| Billing / invoice generation | Revenue loss, customer friction | ✅ Immediately |
| Lead follow-up sequences | Lost pipeline, revenue impact | ✅ Immediately |
| Customer onboarding automations | Churn before activation | ✅ Immediately |
| Data sync / ETL workflows | Stale reports, bad decisions | ✅ Immediately |
| Support ticket routing | Slow response times, escalations | 🟠 High |
| Email campaign triggers | Engagement drop | 🟠 High |
| Inventory sync | Overselling, fulfilment issues | 🟠 High |
| Internal notification workflows | Team awareness gaps | 🟡 Medium |
| Reporting automations | Dashboard staleness | 🟡 Medium |
| Cleanup / archiving workflows | Storage bloat | 🟡 Medium |
The rule: if you'd be upset finding out it hasn't run for 3 days — monitor it now.
Automation monitoring is Layer 6 of a complete founder stack — see The Founder's Monitoring Stack for the full setup order.
Summary
Automation workflows are only valuable when they're running. When they fail silently, the value disappears — and the damage accumulates quietly until someone notices a downstream symptom that could be days or weeks old.
The fix is simple: a start ping and a completion ping in every critical workflow, Smart Silence Detection to catch workflows that stop running entirely, and broken flow detection to catch workflows that start but never finish.
Five minutes per workflow. No code required for Zapier or Make. The peace of mind that your automations are actually running — not just scheduled to run.
Try NotiLens free for 7 days — no credit card required.
Frequently Asked Questions
Does NotiLens require code to monitor Zapier or Make workflows? No. For Zapier and Make, you add HTTP POST steps directly in the workflow UI — no code required. For n8n, you can use HTTP Request nodes (no code) or Code nodes with the SDK for more control. The no-code approach covers the start/completion/error ping pattern without any programming.
What if my Zapier workflow has hundreds of zaps? Start with your top 10 most critical zaps — the ones handling billing, lead follow-up, and customer onboarding. Add NotiLens pings to those first. You don't need to monitor every zap — focus on the ones where silent failure costs you money.
How does Smart Silence Detection handle scheduled vs triggered workflows? Both work the same way. For scheduled workflows (run every hour), the ML model learns the expected ping frequency. For event-triggered workflows (run when a new lead arrives), the model learns your typical event rate. Both alert when pings stop arriving unexpectedly — whether because the schedule stopped or because triggers dried up.
Can I monitor workflows across multiple platforms from one NotiLens account?
Yes. Create separate topics per workflow or per platform — e.g. zapier-lead-followup, make-invoice-generation, n8n-data-sync. Each topic gets its own Smart Silence Detection baseline and alert routing. You can view all workflow health from a single NotiLens dashboard.
What if my Make scenario runs thousands of times per day? Will the pings flood NotiLens? No — NotiLens is designed to handle high-frequency event streams. The ML model learns from the full event volume and uses it to establish a more precise baseline. High-frequency workflows actually benefit more from anomaly detection because the model has more data points to learn from.
My n8n is self-hosted. Does NotiLens work with self-hosted instances? Yes. The NotiLens SDK and HTTP webhook endpoints work from any network environment. For self-hosted n8n specifically, also consider monitoring the n8n process itself — add a server uptime check on the n8n port and a heartbeat ping from n8n's system-level health check endpoint to catch cases where the n8n process itself crashes.