What Is ML Anomaly Detection? A Plain-English Guide for Founders and Developers
ML anomaly detection watches your business metrics and alerts you when something is genuinely abnormal — without you having to define what 'normal' looks like. Here's how it works, why it matters, and how it's different from threshold alerts.
You set a threshold alert: "alert me if revenue drops below $500 in an hour."
It fires at 3am on a Sunday — your slowest hour of the week, when $200/hour is perfectly normal. You wake up. Everything is fine. You start ignoring the alert. Then one day revenue actually drops to $200 during peak hours — and you ignore that too, because the alert cried wolf so many times before.
This is the threshold problem. And ML anomaly detection is the answer to it.
The Problem With Fixed Thresholds
Threshold alerts are simple: if a metric crosses a line, alert. If your error rate goes above 5%, alert. If orders drop below 10 per hour, alert. If response time exceeds 2 seconds, alert.
The problem is that "normal" isn't a fixed number. It varies by:
- Time of day — 10 orders/hour is normal at 2pm, alarming at 2pm on Black Friday, and completely expected at 4am
- Day of week — Monday traffic looks nothing like Saturday traffic
- Seasonality — January is slower than December for most e-commerce businesses
- Growth — a metric that was low three months ago might now be your normal baseline
- External events — a marketing campaign, a product launch, or a viral moment shifts your baseline overnight
Fixed thresholds don't know any of this. They treat every moment the same. The result is one of two failure modes:
Too sensitive: the threshold is set tight and fires constantly during naturally low periods. Alert fatigue sets in. Engineers start ignoring notifications. The alert that matters gets missed.
Too loose: the threshold is set wide enough to stop false positives. Now a real anomaly — a 40% revenue drop during peak hours — doesn't cross it. The problem goes undetected.
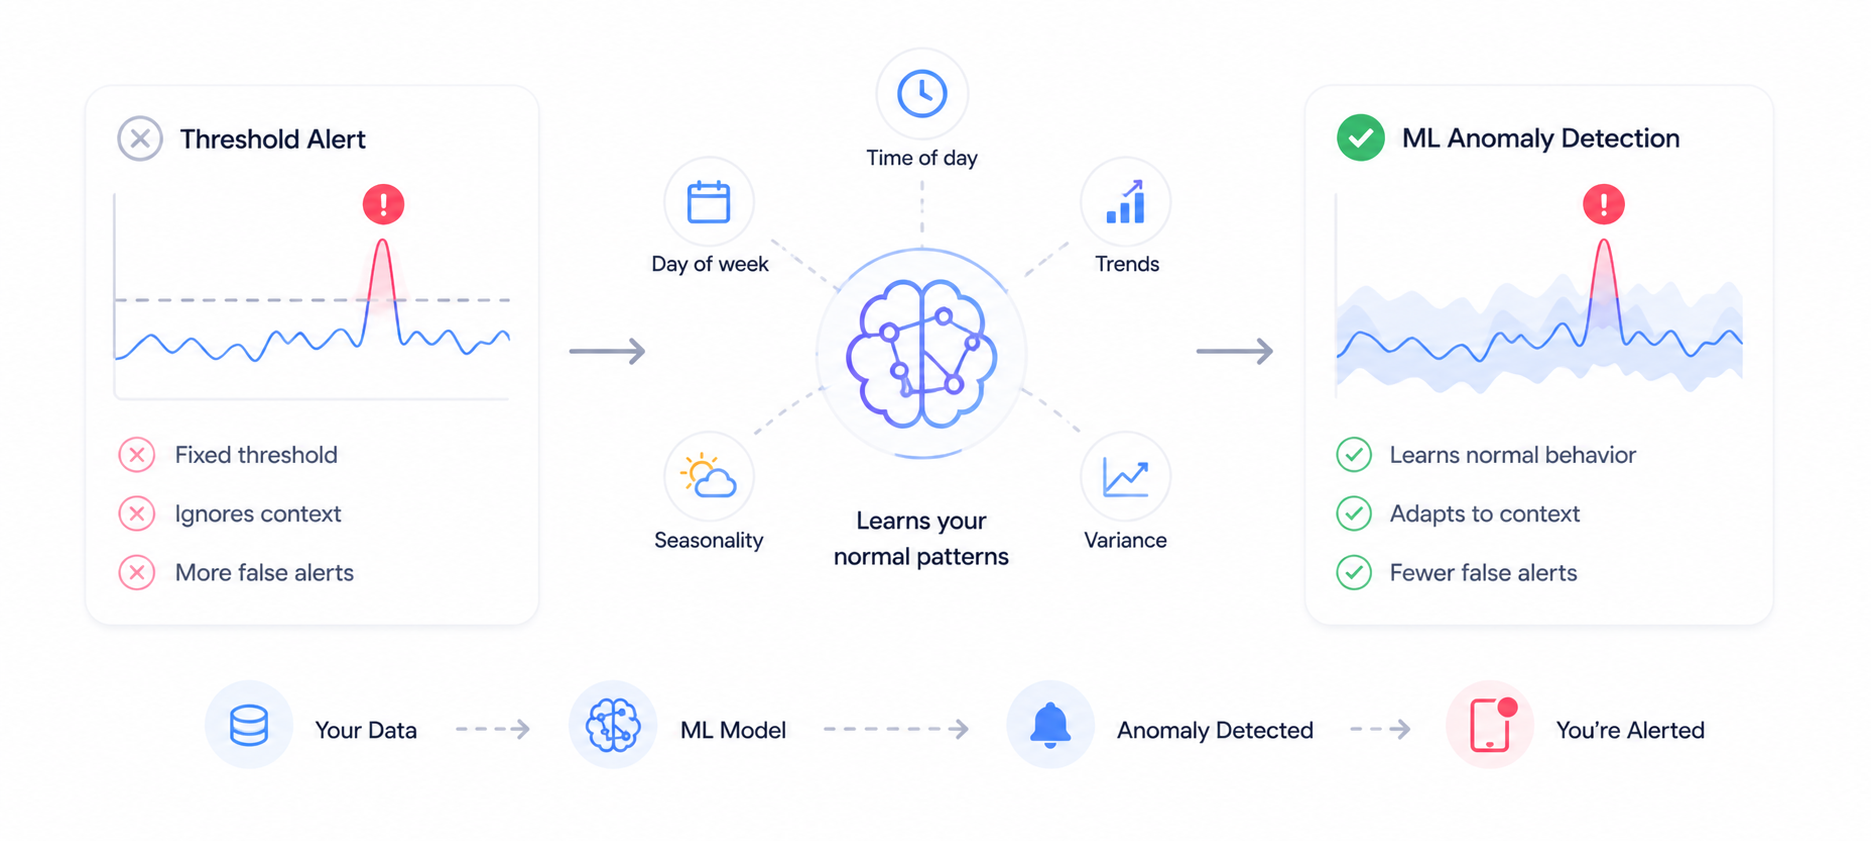
ML anomaly detection solves both failure modes by learning what normal actually looks like for your specific metrics, at your specific traffic patterns, at each specific point in time.
What Is ML Anomaly Detection?
ML anomaly detection is a monitoring approach where a machine learning model continuously learns your metric's normal behaviour and alerts you when an observed value is statistically abnormal — given everything it knows about your patterns.
Instead of asking "did this metric cross a fixed line?", it asks:
"Is this value normal for this metric, at this time of day, on this day of week, given recent trends?"
The answer is contextual. 50 orders/hour might be:
- Normal on a Tuesday afternoon
- Alarmingly low on a Black Friday afternoon
- Suspiciously high on a Tuesday at 3am
A fixed threshold treats all three the same. ML anomaly detection treats each differently because it knows your patterns.
How It Works — Without the Maths
You don't need to understand the maths to understand the concept. Here's an intuitive model:
1. Observation period The model watches your metric over time — orders per hour, payment events per minute, API response times, refund rates, cron job completion times. It doesn't need a long history to start being useful; it learns as it goes.
2. Pattern learning The model identifies your baseline patterns:
- Your typical daily curve (traffic peaks, quiet periods)
- Your weekly cycle (weekday vs weekend differences)
- Your trend (are metrics growing, stable, or declining?)
- Your natural variance (how much does this metric normally fluctuate?)
3. Expectation formation For any given moment, the model forms a prediction: "based on everything I've learned, I expect this metric to be approximately X right now, with Y variance."
4. Anomaly scoring When an observation arrives, the model compares it to the expectation. If the observed value is far enough outside the expected range — accounting for natural variance — it's flagged as anomalous.
5. Alert If the anomaly score exceeds a confidence threshold, an alert fires. Not because the value crossed a fixed line, but because the value is statistically improbable given your known patterns.
ML Anomaly Detection vs Threshold Alerts — Side by Side
| Threshold Alert | ML Anomaly Detection | |
|---|---|---|
| How it works | Alert if metric > X or < Y | Alert if metric is statistically abnormal for this moment |
| Requires manual config | Yes — you define the threshold | No — model learns automatically |
| Adapts to time of day | ❌ No | ✅ Yes |
| Adapts to day of week | ❌ No | ✅ Yes |
| Adapts to growth trends | ❌ No — needs manual updates | ✅ Yes — continuous learning |
| False positive risk | High — fires during natural low periods | Low — knows your natural lows |
| Catches gradual degradation | ❌ No — only catches threshold crossings | ✅ Yes — detects creeping anomalies |
| Setup time | Minutes | Minutes — model learns on its own |
| Best for | Hard limits (never exceed X) | Pattern deviations (something changed) |
The two approaches are complementary, not mutually exclusive. Use threshold alerts for hard limits where any crossing is a problem (error rate must never exceed 10%). Use ML anomaly detection for pattern-based metrics where normal varies (order volume, response time, refund rate).
What ML Anomaly Detection Catches That Thresholds Miss
Gradual degradation
Your API response time increases 15ms per hour over 12 hours. No single measurement crosses your 2-second threshold. But by the end of the day, response time has gone from 200ms to 1.4 seconds — a 7x degradation that will soon cross the threshold and cause user-visible timeouts.
ML anomaly detection catches the trend. The threshold doesn't.
Time-of-day anomalies
Your order volume drops to 30/hour. Your threshold is 20/hour — so no alert. But it's a Saturday afternoon and your normal Saturday afternoon rate is 150/hour. Something is very wrong.
ML anomaly detection knows your Saturday afternoon baseline. The fixed threshold doesn't.
Unusual spikes that indicate problems
Your refund rate spikes to 8%. Your threshold is 10% — no alert. But your normal refund rate is 1.5%, so 8% is a 5x spike that signals a real problem. ML anomaly detection catches the relative change. The threshold misses it.
Recovery false negatives
A metric dips below your threshold, you get an alert, you fix the problem. The metric recovers — but then dips again slightly without crossing the threshold. ML anomaly detection detects the second dip as anomalous even though it doesn't cross the hard line.
The Three Types of Anomalies NotiLens Detects
Point anomalies
A single observation that's far outside the expected range. An order volume of 3/hour when you normally see 80/hour. A refund spike of 25 in one minute when you normally see 2.
Alert speed: immediate — point anomalies are detected on the observation that triggers them.
Contextual anomalies
A value that would be normal in one context but is anomalous in another. 5 orders/hour is normal at 4am but anomalous at 2pm on a Saturday.
Alert speed: immediate — the model knows what's normal for each context.
Trend anomalies
A series of individually non-alarming observations that collectively indicate a problem. Response time creeping from 200ms to 800ms over 4 hours. Refund rate slowly climbing from 1.5% to 4% over a week.
Alert speed: slightly delayed — the model needs enough data points to detect the trend direction. Typically caught within 2–4 anomalous observations.
How NotiLens Implements ML Anomaly Detection
NotiLens applies ML anomaly detection across all monitored event streams automatically — you don't configure it per metric.
What it monitors:
- Event frequency — how often events of each type arrive
- Event value distributions — payment amounts, order values, response times
- Flow completion rates — what percentage of initiated flows complete
- Cross-metric ratios — refund rate relative to order rate, error rate relative to request rate
How it learns:
- Starts learning from the first event received
- Baseline stabilises within the first few days of data
- Continuously updates as your patterns evolve — a new marketing channel, a seasonal shift, or an infrastructure change is automatically incorporated
What you configure: Nothing mandatory. Smart Silence Detection and anomaly detection are enabled by default on every topic. You can optionally:
- Set a minimum confidence threshold for alerts (reduce sensitivity for high-variance metrics)
- Define manual rules on top of ML detection for hard limits
- Snooze anomaly alerts during planned maintenance or low-traffic windows
ML Anomaly Detection + Silence Alerts: How They Work Together
NotiLens uses two complementary ML-powered detection systems:
ML Anomaly Detection — watches the value and rate of events. Fires when an observed metric is statistically abnormal for the current context.
Smart Silence Detection — watches for the absence of events. Fires when expected activity stops for longer than your learned baseline.
| Scenario | Which system catches it |
|---|---|
| Orders dropped from 80/hr to 5/hr — still coming | ML Anomaly Detection |
| Orders stopped completely | Smart Silence Detection |
| Refund rate spiked 4x above baseline | ML Anomaly Detection |
| No refund events for 3 weeks (unusually quiet) | Smart Silence Detection |
| Response time gradually degrading over 6 hours | ML Anomaly Detection (trend) |
| API endpoint received no requests for 2 hours | Smart Silence Detection |
Together they cover the full spectrum: things that are happening but shouldn't be, and things that should be happening but aren't.
For a practical guide on where to apply all of this first, see The Founder's Monitoring Stack.
Real-World Examples
SaaS — Signup rate anomaly
Your normal signup rate is 15/hour on weekday mornings. Tuesday at 10am your rate drops to 2/hour. Smart Silence Detection would catch this only if it went to zero. ML Anomaly Detection catches the drop from 15 to 2 — still some signups, but statistically anomalous for a Tuesday morning.
Investigation finds: a marketing automation tool pushed a broken email campaign that was supposed to drive signups. The links are broken. Fixed within the hour.
E-commerce — Refund spike detection
Your normal refund rate is 2% of orders. On a Wednesday afternoon, it climbs to 9%. Your threshold is 15% — no alert. ML Anomaly Detection fires at 9% because it knows your baseline is 2%, not 15%.
Investigation finds: a fulfilment partner shipped incorrect items for orders placed in a 3-hour window. You catch it in time to contact the affected customers proactively before they contact you.
Developer — API response time trend
Your API normally responds in 180ms (p95). Over 8 hours, response time creeps to 640ms. No single reading crosses your 1-second alert threshold. ML Anomaly Detection fires at 400ms, flagging the trend as anomalous.
Investigation finds: a database index was dropped during a migration and queries are doing full table scans. Fixed before users notice timeouts.
AI agents — Token consumption spike
Your LangChain agent normally uses 3,000–5,000 tokens per task. A new task type starts consuming 45,000 tokens per run — 10x the normal range. ML Anomaly Detection fires on the first run with that consumption level.
Investigation finds: a prompt template change caused the agent to include the full conversation history on every tool call, multiplying token usage. Fixed before the OpenAI bill arrives.
Common Questions About ML Anomaly Detection
Does it need a lot of historical data to work? No. NotiLens starts learning from the first event and becomes increasingly accurate over time. In the first 24–48 hours, the model is conservative — it alerts only on extreme anomalies. By day 7, it has learned your daily and weekly patterns. By day 30, it handles seasonal variation well.
Will it cause alert fatigue during a legitimate traffic spike? No — a genuine business spike (a viral post, a successful campaign) becomes your new normal quickly. The model adapts to sustained changes. Where it fires is on sudden, unexplained deviations that don't fit your learned pattern.
What if my metrics are highly variable by nature? High-variance metrics train a wider expected range. The model learns the variance as part of the baseline — so a normally volatile metric won't alert on every fluctuation, only on deviations that are anomalous even accounting for its typical volatility.
Can I combine ML anomaly detection with manual threshold rules? Yes. NotiLens lets you layer manual smart rules on top of ML detection. Use ML for pattern-based alerts and manual thresholds for hard limits. Both alert systems operate independently — either can fire an alert.
How is this different from what Datadog does? Datadog's anomaly detection is powerful but requires explicit configuration per metric, trained on a metric stream you've already defined. NotiLens applies anomaly detection automatically across all event streams without per-metric setup — designed for founders and small teams who don't have a dedicated observability engineer to configure it.
Summary
Fixed thresholds are blunt instruments. They treat every moment the same, fire on natural low periods, and miss relative anomalies that don't cross the hard line.
ML anomaly detection learns what normal actually looks like for your business — at each time of day, each day of week, accounting for trends and growth — and alerts only when something is genuinely statistically abnormal.
The result: fewer false positives, faster detection of real problems, and no manual threshold maintenance as your business grows and patterns evolve.
Combined with Smart Silence Detection, NotiLens gives you complete coverage: anomalous activity you didn't expect, and expected activity that's gone missing.
Try ML anomaly detection free for 7 days — no credit card required.