AI Agent Monitoring in Production — What to Watch and Why It Matters
There are two questions you can ask about an AI agent running in production. Is it running? And is it working? Most monitoring stacks answer the first well. None of them answer the second.
There are two questions you can ask about an AI agent running in production.
The first: is it running?
The second: is it working?
Most monitoring stacks answer the first question well. Uptime checks, process monitors, health endpoints — if the agent process is alive, they'll tell you.
What they won't tell you is whether the agent is doing what it's supposed to do, within reasonable resource bounds, producing output that's actually useful.
That gap — between running and working — is where AI agent silent failures live. And it's a gap that conventional monitoring was never built to close.
Why AI Agents Fail Differently From Regular Software
Regular software has a deterministic relationship between input and output. Given the same input, it produces the same output. Failures are binary — the function either runs or it doesn't, succeeds or throws an exception.
This is the failure model every monitoring tool was built around. Something fails. An exception is thrown. An error is logged. An alert fires.
AI agents break this model completely.
An agent given the same task twice will likely take different paths, use different tools, and produce different outputs. Whether it succeeded isn't a binary question — it's a judgment about whether the output was actually useful. And that judgment requires knowing what the agent was supposed to do, what it actually did, and whether those two things match.
None of your existing monitoring tools know any of that.
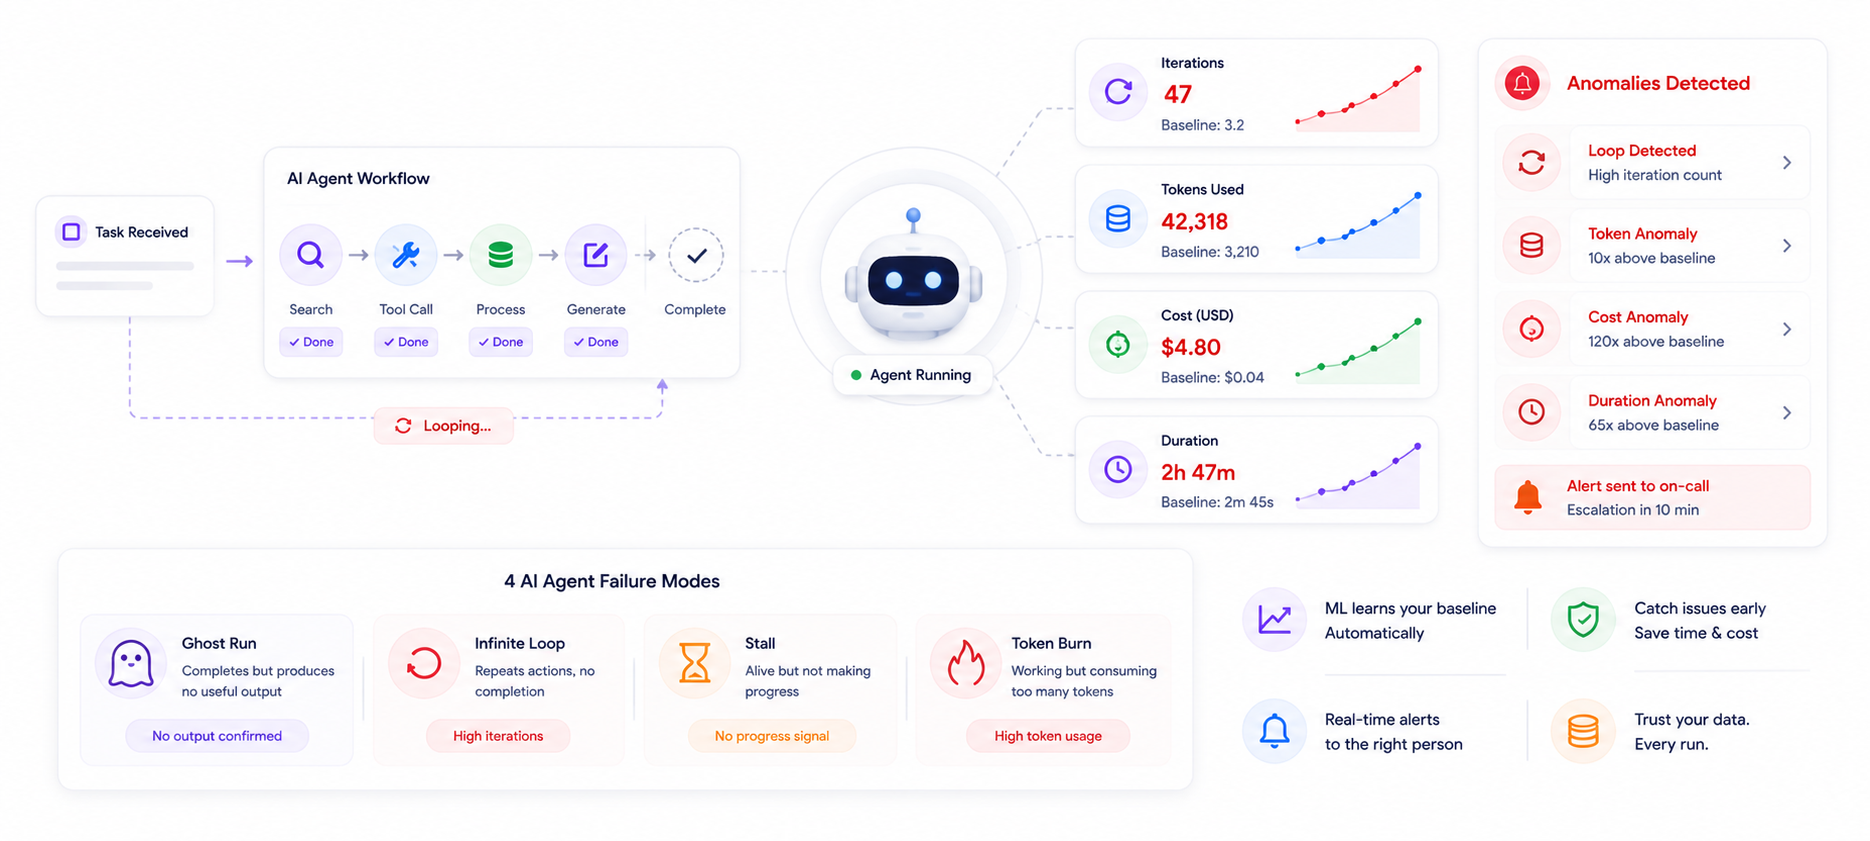
The Four Failure Modes That Look Like Success
Ghost Run — Completed, Produced Nothing Useful
The agent finishes. Exit code clean. Task marked done. Output exists — technically. But the output doesn't accomplish the task. The agent evaluated its own work using criteria that were too loose, met its own bar, and finished.
Your monitoring saw: successful run. Reality: wasted compute, wrong output, downstream processes inheriting bad state.
Ghost runs are the hardest failure mode to catch because they look identical to a successful run from every infrastructure angle. The agent completed. It just completed incorrectly.
Infinite Loop — Running, Producing Nothing
The agent keeps running. Tool calls keep firing. Tokens keep accumulating. The process looks healthy by every infrastructure metric. What's actually happening: the agent called the same tool 47 times and can't converge on a result. No completion event ever arrives.
Your monitoring saw: healthy process, slight delay. Reality: $4.80 in tokens, zero useful output, worker occupied for hours.
A looping agent looks identical to a healthy agent doing legitimate multi-step research. The process is running. API calls are completing. Nothing in your infrastructure signals a problem.
Stall — Alive, Not Progressing
The agent is waiting. For an API response. For a tool result. For a resource that never arrives. Not looping — just stuck. Process alive, no progress, no timeout fired because the timeout was set too generously.
Your monitoring saw: healthy process, normal latency. Reality: stuck for 4 hours, dependent processes blocked, output delayed indefinitely.
Token Burn — Working, But at 10x Cost
The agent is legitimately working — not looping, not stalling, actually making progress. But task scope expanded somewhere, prompting is inefficient, or a reasoning loop is consuming tokens without converging efficiently. Finishes eventually. OpenAI bill for that one run: $12 instead of $0.04.
Your monitoring saw: successful run. Reality: 300x cost overrun, no signal it happened until the invoice.
Why Conventional Monitoring Misses All Four
Uptime monitoring — watches whether your service is responding. The agent process is running. ✅ Green. No awareness of whether it's progressing or producing anything useful.
Error rate monitoring — watches for exceptions and non-2xx responses. Ghost runs, loops, stalls, and token burns don't throw exceptions. Error rate stays clean. ✅ Green.
APM tools — watch latency and throughput at the service level. A looping agent makes API calls at normal latency. A stalling agent looks like a slow run. Neither surfaces as an anomaly in throughput metrics. ✅ Green.
Log monitoring — can surface these failures, but only if you're watching the right logs for the right pattern at the right time. Logs are reactive. They require you to know what to look for before you can find it.
Threshold alerts — require you to define abnormal before the failure happens. For a new agent or a changing workload, you don't know what normal looks like yet. You can't threshold what you haven't measured.
The fundamental gap: every conventional monitoring tool watches for something going wrong. AI agent silent failures are defined by the absence of something going right — and that requires a completely different approach.
The Four Signals That Actually Matter
1. Loop Count vs Baseline
How many iterations does your agent normally take to complete a task? If it normally finishes in 3–5 tool calls and today's run hit 47 — something is wrong. The agent is stuck in a pattern it can't exit.
This is learnable from your agent's run history. After enough runs, NotiLens knows what normal looks like for this agent on this task type. Deviation from that learned baseline is the signal — not a manually configured threshold.
2. Token Consumption vs Baseline
How many tokens does a normal run consume? If a run that normally costs $0.04 costs $12 — the agent went somewhere it shouldn't have. Either scope expanded unexpectedly or a reasoning loop ran far longer than it should.
ML anomaly detection tracks token consumption per run against your learned baseline. A run consuming 10x normal triggers a cost anomaly alert. No budget cap to configure. The baseline is the reference point.
3. Duration vs Baseline
How long does a normal run take? A stall looks like a slow run from the outside. But a run that normally completes in 3 minutes and is still running at 45 minutes is a different kind of problem.
Duration deviation catches stalls that loop count and token consumption miss. NotiLens learns your agent's normal duration distribution and fires when a run extends significantly beyond it.
4. Output Confirmation
Did the agent actually produce something useful before it completed?
A ghost run — an agent that finishes without producing useful output — is caught by tracking whether an output event was emitted before the completion event. If run.complete() fires without run.output_generated() firing first — NotiLens flags it.
This is the explicit check that "the agent finished" and "the agent produced useful output" are not the same event.
How NotiLens Monitors AI Agents
NotiLens tracks the full agent lifecycle — start, progress, iterations, output, completion — and learns your baseline per agent per task type automatically. No thresholds to configure. No YAML. No manual setup beyond instrumenting the agent.
Install
pip install notilens            # Python
npm install @notilens/notilens  # Node.js
Option 1 — Auto-Instrumentation
The fastest path. patch=True auto-instruments OpenAI, Anthropic, and LangChain calls with no manual event tracking needed:
Python:
import notilens

nl = notilens.init(
    name="my-agent",
    token="YOUR_TOKEN",
    secret="YOUR_SECRET",
    patch=True  # auto-instruments all AI calls
)
Node.js:
import { NotiLens } from '@notilens/notilens';

const nl = NotiLens.init('my-agent', {
  token: 'YOUR_TOKEN',
  secret: 'YOUR_SECRET'
});
Option 2 — Full Instrumentation
For complete visibility including loop count tracking, output confirmation, and ghost run detection:
Python:
import notilens

nl  = notilens.init(name="research-agent", token="YOUR_TOKEN", secret="YOUR_SECRET")
run = nl.task("research")
run.start()

try:
    run.progress("Starting research")

    for i, step in enumerate(steps):
        run.loop(f"[{i+1}] Tool: {step.tool_name}")  # ✦ loop signal — called every iteration
        run.metric("tool_calls", 1)                   # accumulates per run

        result = agent.execute(step)
        run.metric("tokens",   result.usage.total_tokens)
        run.metric("cost_usd", result.usage.cost)

    # ✦ Ghost run detector — only fires when output is actually produced
    run.output_generated(f"Research complete — {len(steps)} steps")
    run.complete(f"Processed {len(steps)} steps")

except Exception as e:
    run.fail(str(e))
Node.js:
import { NotiLens } from '@notilens/notilens';

const nl  = NotiLens.init('research-agent', { token: 'YOUR_TOKEN', secret: 'YOUR_SECRET' });
const run = nl.task('research');
run.start();

try {
  run.progress('Starting research');

  for (const [i, step] of steps.entries()) {
    run.loop(`[${i+1}] Tool: ${step.toolName}`);  // ✦ loop signal — called every iteration
    run.metric('tool_calls', 1);                   // accumulates per run

    const result = await agent.execute(step);
    run.metric('tokens',   result.usage.totalTokens);
    run.metric('cost_usd', result.usage.cost);
  }

  // ✦ Ghost run detector — only fires when output is actually produced
  run.outputGenerated(`Research complete — ${steps.length} steps`);
  run.complete(`Processed ${steps.length} steps`);

} catch (err) {
  run.fail(err.message);
}
Stall Detection
For agents pausing on slow external tools or APIs, use run.wait():
Python:
run.wait("Awaiting API response")
result = call_slow_external_api()
run.progress("API response received")
run.wait() is non-terminal — the run continues. Smart Silence Detection learns how long your agent normally spends between events and fires if the gap becomes anomalous.
What the Alert Looks Like in NotiLens
✅ task.started        Research agent — task started
🔄 task.loop           [1] Tool: web_search
🔄 task.loop           [2] Tool: web_search
🔄 task.loop           [3] Tool: web_search
...
🔄 task.loop           [40] Tool: web_search
⚠️  Anomaly detected   Loop count 40 — exceeds baseline (avg: 3.2)
                       No output_generated event received
                       tool_calls: 40 | tokens: 42,000 | cost_usd: $0.0084
   → Push notification fired
   → On-call engineer paged
   → Escalation policy triggered (10 min to ACK)
Loop count deviation. No output event. Token anomaly. Three signals, one alert — fired while the agent is still running, not after the morning review or the end-of-month invoice.
ML Baseline Learning — No Thresholds to Configure
NotiLens ML anomaly detection learns your agent's normal behaviour automatically.
After enough runs, NotiLens knows:
- How many iterations this agent normally takes on this task type
- How many tokens a normal run consumes
- How long a normal run takes
- Whether output is normally produced before completion
When a run deviates from that learned baseline — in any of these dimensions — the alert fires. The deviation is the signal. Not a manually configured threshold that becomes stale as your agent evolves.
Full Agent Monitoring Checklist
-
run.start()fires when task begins -
run.loop()called on every agent iteration -
run.metric("tool_calls", 1)accumulates per iteration -
run.metric("tokens", n)tracks token usage -
run.metric("cost_usd", n)tracks cost per run -
run.wait()fires when agent pauses on slow external calls -
run.output_generated()fires only when useful output is confirmed -
run.complete()fires on successful completion -
run.fail()fires on unhandled exceptions -
run.error()fires on non-fatal tool errors -
run.timeout()fires if agent exceeds SLA window - Smart Silence Detection active — alerts if agent stalls with no events
- On-call routing configured for anomaly alerts
- Tested — ran a looping agent and confirmed NotiLens detected and alerted
Works with LangChain, CrewAI, AutoGen, LlamaIndex, Pydantic AI, or any custom agent loop. No framework dependency.
Summary
AI agents fail in ways that conventional monitoring was never built to catch. They complete without completing correctly. They run without producing useful output. They consume resources at 10x normal cost with no external signal.
The monitoring layer that catches these failures watches agent behaviour — loop count, token consumption, duration, output confirmation — against a learned baseline per agent per task type. Not infrastructure metrics. Not error rates. The agent's own run pattern compared against what normal actually looks like.
That's the difference between knowing your agent is running and knowing your agent is working.
For how AI agent monitoring fits into a complete founder monitoring stack, see The Founder's Monitoring Stack.
Try NotiLens free for 7 days — no credit card required.
Related reading: