How NotiLens Detects Silent Failures in ETL Pipelines — Records, Duration, and Output Monitoring
ETL pipelines fail silently more than any other part of a data stack. The job runs. The exit code is 0. Zero records were processed. Your data warehouse is stale and nobody knows. Here's how to catch it.
Your ETL pipeline ran last night. Exit code 0. No errors in the logs. The job completed in 4 minutes, which is normal.
Zero records were processed.
Your data warehouse hasn't been updated in 24 hours. Your dashboards are showing yesterday's data. Business decisions are being made on stale numbers. And nobody knows — because the job looked completely healthy from the outside.
This is the ETL silent failure. It's more common than most data teams admit, it's invisible to every conventional monitoring tool, and it's the class of failure that corrupts the trust in your data platform more than any outage ever could.
Why ETL Pipelines Fail Silently
ETL jobs have a property that makes them uniquely prone to silent failure: success is ambiguous.
A web server either responds or it doesn't. A database query either returns results or it throws an error. But an ETL job can complete "successfully" — exit code 0, no exceptions — while doing absolutely nothing useful.
Schema changes upstream Your source system changes a column name or data type. Your extraction query still runs. It returns zero rows matching the new schema. The job exits cleanly. Nothing in your warehouse was updated.
Empty source data The upstream system had no new records during the extraction window. The job runs correctly — there's just nothing to process. Legitimate or a broken upstream feed? You can't tell without output monitoring.
Silent deduplication over-matching Your deduplication logic has a bug. Every record is flagged as a duplicate and skipped. The job "successfully" processes 10,000 records — and writes zero to the target.
Transformation filter over-exclusion A WHERE clause or filter condition was changed. Now it excludes 99% of records it previously processed. The job runs, writes a fraction of expected records, exits cleanly.
Target write failure with silent catch
The write to your data warehouse fails — connection timeout, permissions issue, quota exceeded. A broad except: pass in your pipeline code catches the exception silently. The job exits 0. Nothing was written.
Incremental load window misconfiguration Your incremental load extracts records created "in the last 24 hours." A timezone configuration change shifts the window. Records are being double-processed or skipped entirely depending on the direction of the shift.
Partition or batch size collapse A memory pressure issue causes your batch size to collapse from 10,000 to 1 record per write. The job "completes" in 47 hours instead of 4 minutes — by which point your downstream jobs have already run on stale data.
In every case: exit code 0. No alert. No visible failure. Just stale data and eroding trust in your data platform.
What Conventional Monitoring Misses
Let's be specific about each monitoring layer and why it doesn't catch ETL silent failures:
Uptime monitors - check if your server responds. Your ETL server is up. Green.
Error trackers (Sentry) — capture unhandled exceptions. If the exception is caught and swallowed, Sentry sees nothing. If the schema change causes zero rows to return (not an error, just an empty result), Sentry fires nothing.
Log monitors — watch for error-level log entries. A job that runs and processes zero records may log "Completed successfully. Records processed: 0" at INFO level. Your log monitor sees no errors.
Cron monitors (Cronitor, Healthchecks.io) — expect a ping at a defined interval. If your job sends a ping on completion, the ping arrives. The cron monitor is happy. It has no awareness of how many records the job processed.
Datadog — can monitor that the job ran and how long it took. Without explicit instrumentation of records processed, it has no way to distinguish a healthy run from a zero-record run.
Your data warehouse — will show you that no data arrived, but only if you go looking. It doesn't push an alert. It waits for you to notice.
The gap: all of these tools watch whether the job ran. None of them watch whether the job did anything.
The Three Monitoring Dimensions That Matter for ETL
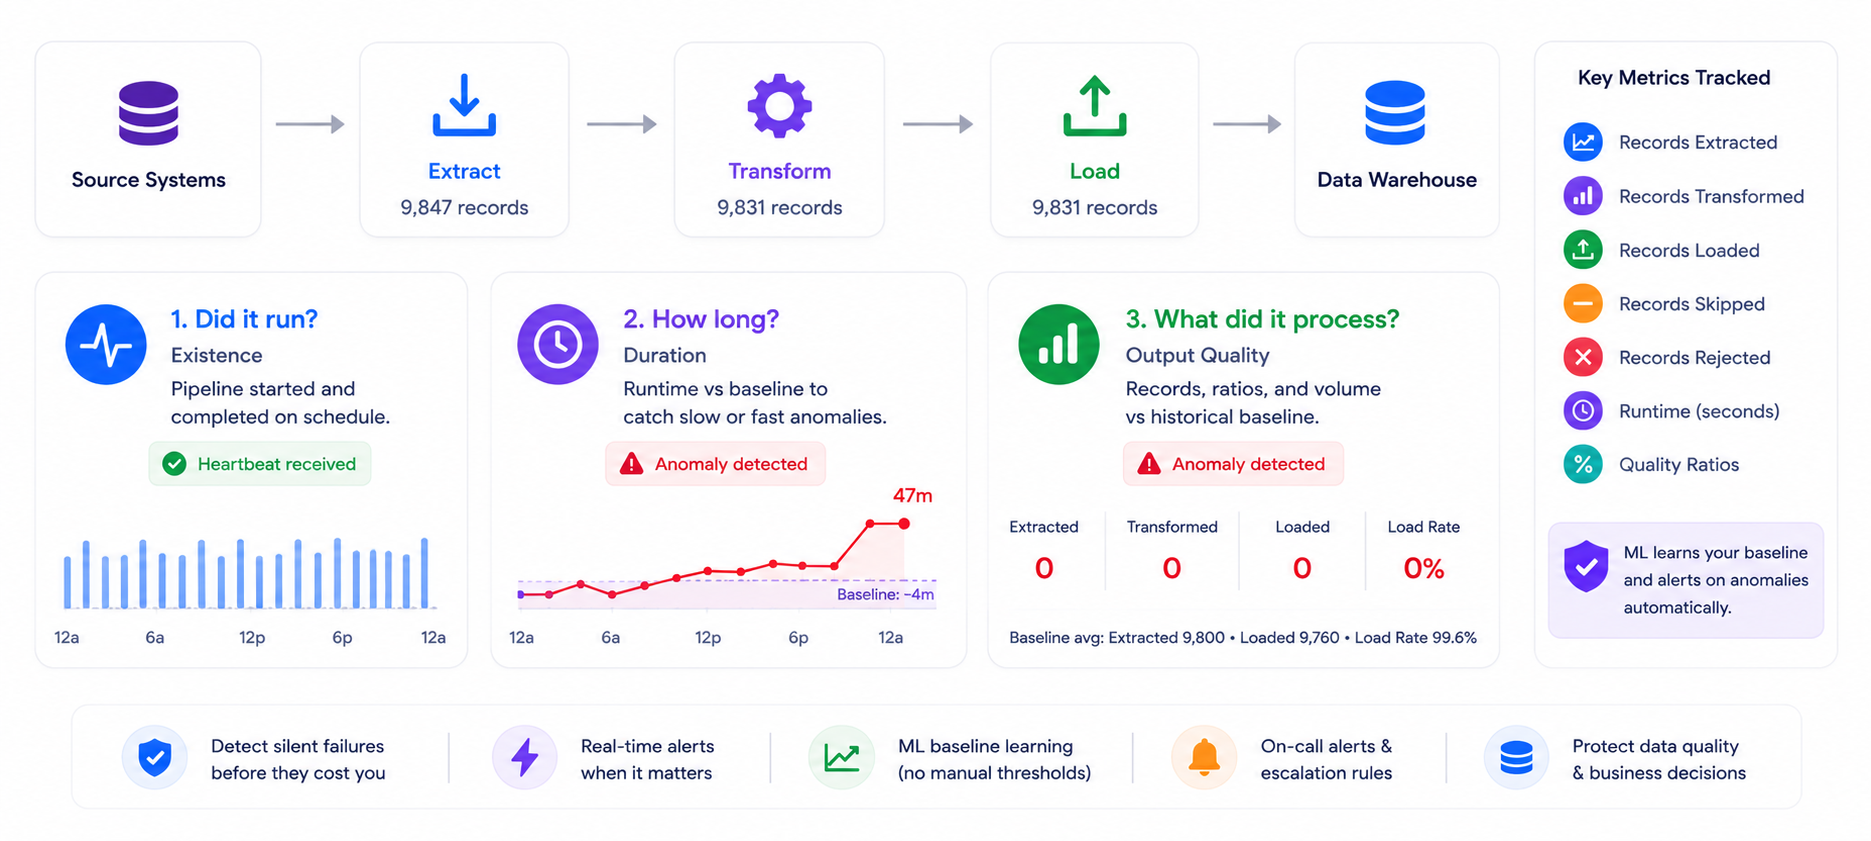
For an ETL pipeline to be properly monitored, you need visibility across three dimensions:
Dimension 1 — Did it run? (Existence)
The heartbeat layer. Did the job start? Did it complete? Did it fail?
This is what cron monitors give you. It's necessary but insufficient. A job that runs and processes zero records passes this check.
Dimension 2 — How long did it take? (Duration)
Duration is a proxy for data volume. If your pipeline normally takes 4 minutes and today it took 47 hours — something is wrong even if the exit code is 0.
Duration anomalies catch:
- Batch size collapse (job takes much longer than normal)
- Empty source data (job completes faster than normal — nothing to process)
- Resource contention (job takes much longer due to competing workload)
- Partition explosion (job takes much longer due to unexpected data volume)
Dimension 3 — What did it process? (Output quality)
The most important dimension and the most commonly missing one.
Records extracted, records transformed, records loaded. Records skipped, records rejected, records deduplicated. The ratio of input to output. Variance from your historical baseline.
A job that processed 10,000 records yesterday and 0 today is a silent failure regardless of exit code or duration.
How NotiLens Monitors ETL Pipelines
NotiLens covers all three dimensions via the SDK task lifecycle. The pattern: run.start() at the beginning of the pipeline, run.metric() throughout to track output quality, and run.complete() at the end. Smart Silence Detection and ML anomaly detection handle the baseline learning automatically.
Install
pip install notilens
Basic ETL Pipeline Instrumentation
import notilens
import time

nl  = notilens.init(name="etl-pipeline")  # token/secret from env
run = nl.task("customer-data-sync")

run.start()
start_ts = time.time()

try:
    # ── Extract ───────────────────────────────────────────────────────────────
    raw_records = extract_from_source()
    run.metric("records_extracted", len(raw_records))
    run.progress(f"Extracted {len(raw_records)} records from source")

    # ── Transform ─────────────────────────────────────────────────────────────
    transformed, skipped, rejected = transform(raw_records)
    run.metric("records_transformed", len(transformed))
    run.metric("records_skipped",     len(skipped))
    run.metric("records_rejected",    len(rejected))
    run.progress(f"Transformed {len(transformed)} | skipped {len(skipped)} | rejected {len(rejected)}")

    # ── Load ──────────────────────────────────────────────────────────────────
    loaded = load_to_warehouse(transformed)
    run.metric("records_loaded",  loaded)
    run.metric("records_failed",  len(transformed) - loaded)

    # ── Duration ──────────────────────────────────────────────────────────────
    # auto calculated and passed
    run.complete(
        f"ETL complete — {loaded} records loaded"
    )

except Exception as e:
    run.fail(f"ETL failed: {str(e)}")
    raise
What NotiLens does with this data:
- Smart Silence Detection — if the pipeline stops running entirely, alerts automatically based on your learned schedule. No manual window to configure.
- ML anomaly detection on
records_loaded— if today's run loads 0 records when your baseline is 8,000–12,000, NotiLens alerts. No threshold to set. - ML anomaly detection on auto calculated duration — if today's run takes 2 hours when your baseline is 4 minutes, NotiLens alerts.
- Broken flow detection — if
run.start()fires butrun.complete()never arrives, NotiLens alerts.
Multi-Stage Pipeline Monitoring
For pipelines with distinct stages — each stage gets its own progress checkpoint:
import notilens
import time

nl  = notilens.init(name="etl-pipeline")
run = nl.task("multi-stage-pipeline")

run.start()

try:
    # ── Stage 1: Extraction ───────────────────────────────────────────────────
    run.progress("Stage 1: Extraction starting")
    stage1_start = time.time()

    raw = extract_from_api()

    run.metric("stage1_records",  len(raw))
    run.metric("stage1_duration", round(time.time() - stage1_start, 2))
    run.progress(f"Stage 1 complete — {len(raw)} records extracted")

    if len(raw) == 0:
        # ✦ Empty extraction — could be legitimate or a broken upstream
        # NotiLens ML will detect if this is anomalous vs your baseline
        run.progress("Stage 1: zero records extracted — possible upstream issue")

    # ── Stage 2: Enrichment ───────────────────────────────────────────────────
    run.progress("Stage 2: Enrichment starting")

    enriched, enrichment_failures = enrich_records(raw)

    run.metric("stage2_enriched",  len(enriched))
    run.metric("stage2_failures",  enrichment_failures)
    run.progress(f"Stage 2 complete — {len(enriched)} enriched, {enrichment_failures} failed")

    # ── Stage 3: Load ─────────────────────────────────────────────────────────
    run.progress("Stage 3: Loading to warehouse")
    stage3_start = time.time()

    loaded, failed = load_to_warehouse(enriched)

    run.metric("stage3_loaded",   loaded)
    run.metric("stage3_failed",   failed)
    run.metric("stage3_duration", round(time.time() - stage3_start, 2))

    # ── Summary ───────────────────────────────────────────────────────────────


    run.complete(
        f"Pipeline complete — {loaded} loaded, {failed} failed"
    )

except Exception as e:
    run.fail(f"Pipeline error: {str(e)}")
    raise
Each stage's duration and record count can be tracked independently. If Stage 1 extracts 10,000 records but Stage 3 loads only 200 — that ratio is visible in NotiLens and flagged as anomalous compared to your baseline load ratio.
Data Quality Ratio Monitoring
Beyond raw record counts, track the ratios that signal data quality problems:
# After extraction and loading
total_extracted = 10_000
total_loaded    = 9_847
total_skipped   = 120
total_rejected  = 33

# ── Quality ratios ────────────────────────────────────────────────────────────
load_rate       = round(total_loaded    / total_extracted * 100, 2)  # 98.47%
skip_rate       = round(total_skipped   / total_extracted * 100, 2)  # 1.20%
rejection_rate  = round(total_rejected  / total_extracted * 100, 2)  # 0.33%

run.metric("load_rate_pct",      load_rate)
run.metric("skip_rate_pct",      skip_rate)
run.metric("rejection_rate_pct", rejection_rate)
What ML anomaly detection catches from these ratios:
- Load rate drops from 98% to 40% → something is wrong with the transformation or load step
- Skip rate spikes from 1% to 60% → your deduplication or filter logic is over-excluding
- Rejection rate spikes from 0.3% to 15% → schema mismatch or data quality problem upstream
These ratio anomalies are invisible to every tool that only tracks whether the job ran. NotiLens ML learns your normal ratios and alerts when they deviate significantly — without any manual threshold configuration.
Incremental Load Monitoring
Incremental loads have an additional failure mode: the extraction window itself can be wrong. Track the time range being processed:
from datetime import datetime, timezone, timedelta

# Define the extraction window
window_start = datetime.now(timezone.utc) - timedelta(hours=24)
window_end   = datetime.now(timezone.utc)

raw = extract_incremental(window_start, window_end)

run.metric("window_hours",    24)
run.metric("records_per_hour", len(raw) / 24 if len(raw) > 0 else 0)
run.progress(
    f"Incremental load: {len(raw)} records from "
    f"{window_start.strftime('%Y-%m-%d %H:%M')} to "
    f"{window_end.strftime('%Y-%m-%d %H:%M')}"
)
records_per_hour is the key metric for incremental loads. If your pipeline normally processes 400 records/hour and today it processed 2 records/hour — that's a silent failure even if the total record count looks "reasonable" in absolute terms.
Alerting on Zero Records Explicitly
For pipelines where zero records is always a failure (never legitimate), use run.error() to flag it explicitly — non-terminal, the run continues but an alert fires:
raw_records = extract_from_source()

if len(raw_records) == 0:
    run.error(
        "Extraction returned 0 records — possible upstream issue, "
        "schema change, or broken feed"
    )
    # run continues — doesn't fail the job, but alerts immediately

run.metric("records_extracted", len(raw_records))
Use run.error() for zero-record extractions where you know it's always wrong. Use ML anomaly detection (via run.metric() alone) for pipelines where zero records is occasionally legitimate and you want the model to determine what's anomalous in context.
ETL Monitoring Checklist
Before you consider an ETL pipeline properly monitored:
-
run.start()fires at the beginning of every pipeline run -
run.complete()fires at the end of every successful run -
run.fail()fires on any unhandled exception -
run.metric("records_extracted", ...)tracked per run -
run.metric("records_loaded", ...)tracked per run -
run.metric("records_skipped", ...)tracked per run -
run.metric("records_rejected", ...)tracked per run -
run.metric("runtime_seconds", ...)tracked per run - Quality ratios tracked (load rate, skip rate, rejection rate)
- Smart Silence Detection active — alerts if pipeline stops running
- Broken flow detection active — alerts if run starts but never completes
- ML anomaly detection learning your baseline record volume and duration
-
run.error()configured for zero-record extractions where applicable - On-call routing configured for pipeline failures
- Tested — deliberately ran a zero-record pipeline and confirmed alert fired
What a Healthy Run vs a Silent Failure Looks Like in NotiLens
Healthy run:
✅ task.started           Customer data sync — pipeline started
⚙️  task.progress         Stage 1: Extraction starting
⚙️  task.progress         Stage 1 complete — 9,847 records extracted
⚙️  task.progress         Stage 2: Transformation complete — 9,831 transformed
⚙️  task.progress         Stage 3: Loading to warehouse
✅ task.completed         ETL complete — 9,831 records loaded in 224s
   records_extracted: 9,847 | records_loaded: 9,831 | load_rate: 99.8%
   runtime_seconds: 224 | skip_rate: 0.1% | rejection_rate: 0.05%
Silent failure — zero records:
✅ task.started           Customer data sync — pipeline started
⚙️  task.progress         Stage 1: Extraction starting
⚙️  task.progress         Stage 1: zero records extracted — possible upstream issue
⚠️  task.error            Extraction returned 0 records — possible upstream issue
✅ task.completed         ETL complete — 0 records loaded in 12s
   records_extracted: 0 | records_loaded: 0 | load_rate: 0%
   ⚠️ Anomaly: records_loaded = 0, baseline avg = 9,847
   → Push notification fired → On-call engineer paged
Silent failure — anomalous duration:
✅ task.started           Customer data sync — pipeline started
⚙️  task.progress         Stage 1: Extraction starting
⚙️  task.progress         Stage 1 complete — 9,847 records extracted
⚙️  task.progress         Stage 2: Transformation complete — 9,831 transformed
⚙️  task.progress         Stage 3: Loading to warehouse
   [47 minutes pass with no progress event]
🔇 smart_silence.fired    No progress in 47 min — pipeline stalled (baseline: 4 min)
   → Push notification fired → Escalation policy triggered
Summary
ETL pipelines are the most silently-failing component in most data stacks. Exit code 0 means the job ran. It says nothing about whether the job did anything useful.
Monitoring ETL pipelines properly requires three dimensions: did it run (heartbeat), how long did it take (duration anomaly), and what did it actually process (output quality). Most tools cover the first. Almost none cover the second and third without explicit instrumentation.
NotiLens covers all three — Smart Silence Detection for heartbeat, ML anomaly detection on duration and record counts, and broken flow detection for pipelines that start but never complete. The SDK integration is four run.metric() calls per pipeline stage.
One caught zero-record run that would have left your warehouse stale for 24 hours pays for months of NotiLens.
Try NotiLens free for 7 days — no credit card required.
For how ETL monitoring fits into a complete founder monitoring stack, see The Founder's Monitoring Stack.
Frequently Asked Questions
Does NotiLens work with Airflow, Prefect, or dbt pipelines?
Yes. The NotiLens SDK is framework-agnostic. Add run.start(), run.metric(), and run.complete() inside your Airflow operator, Prefect task, or dbt on-run-end hook. For Airflow specifically, a custom callback or a final task in your DAG that calls the NotiLens SDK covers the full pipeline lifecycle.
What if my pipeline legitimately processes zero records sometimes?
Use ML anomaly detection via run.metric("records_loaded", 0) rather than run.error(). The model learns that zero records occasionally occurs in your pipeline and won't alert on it if it's within your historical variance. If zero records is always wrong — use run.error() to flag it explicitly every time.
How do I monitor multiple pipelines from one NotiLens account?
Create separate topics per pipeline — e.g. etl-customer-sync, etl-orders-warehouse, etl-events-aggregation. Each topic gets its own ML baseline for records, duration, and quality ratios. You can view all pipeline health from a single NotiLens dashboard.
My pipeline runs in parallel batches — how does this work with the SDK?
Create one nl.task() run per batch worker. Each batch gets its own run context, its own metrics, and its own broken flow detection. Aggregate metrics (total records across all batches) can be tracked in a parent run that starts before all batches and completes after the last one finishes.
What's the difference between NotiLens and a data observability tool like Monte Carlo or Great Expectations? Data observability tools (Monte Carlo, Great Expectations, Soda) run validation rules on your data after it lands in the warehouse — checking for nulls, schema drift, referential integrity, distribution anomalies. They're the right tool for data quality validation at rest. NotiLens monitors the pipeline itself — whether it ran, how long it took, how many records it processed, whether the flow completed. The two are complementary: NotiLens catches pipeline failures in real time, data observability catches data quality issues after the fact.