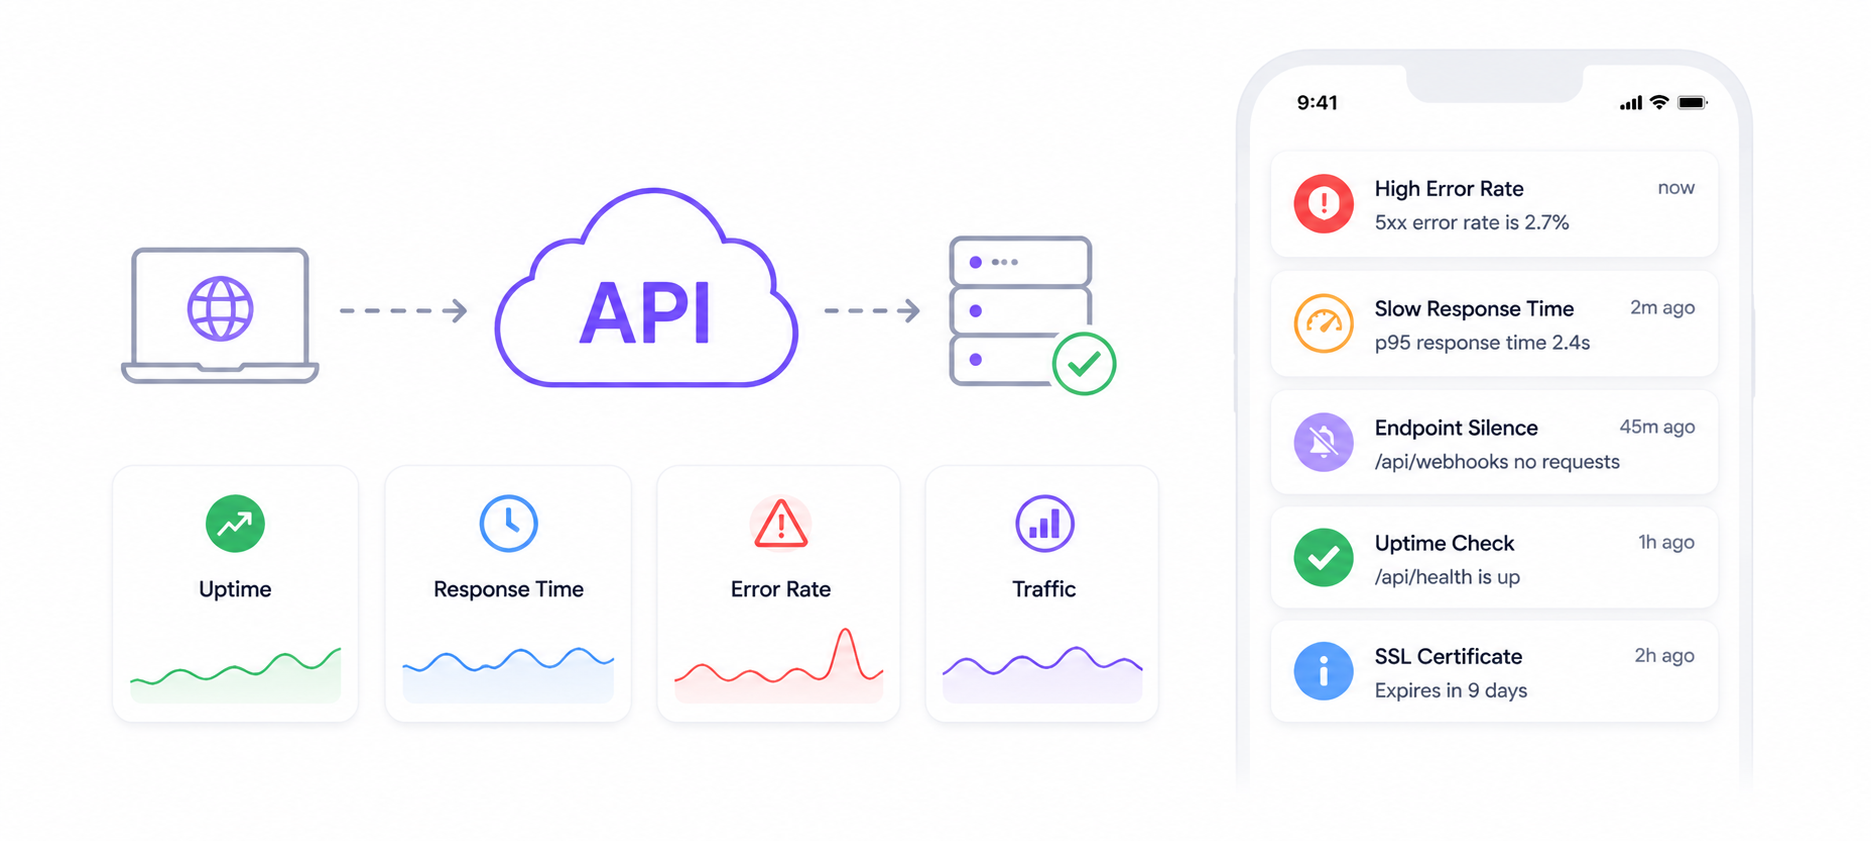
API Monitoring Guide: Response Time, Uptime, and Error Rates
Most teams monitor if their API is up. Few monitor if it's actually healthy. This guide covers the full picture — response time degradation, error rate spikes, silent endpoint failures, and how to alert on all of it.
Your API is up. That's what your uptime monitor says.
But three endpoints are returning 500s for 8% of requests. Your p99 response time has doubled in the last hour. A critical webhook endpoint has been silently timing out for 6 hours.
All of this is invisible to a simple uptime check.
This guide covers what API monitoring actually means in production — what to measure, what to alert on, and how to set it up without an enterprise observability stack.
What Uptime Monitoring Misses
An uptime monitor does one thing: it sends a request to a URL every few minutes and checks if it gets a 200 back. If it does — green. If it doesn't — alert.
This catches the obvious failure: your server crashed and your API is completely down.
It misses everything else:
- Partial failures — your API is up but
/api/paymentsis returning 500s for 12% of requests while/api/health(the one your uptime monitor checks) returns 200 every time - Response time degradation — your API is responding but taking 8 seconds instead of 200ms. Users are experiencing timeouts but your uptime monitor sees success
- Error rate spikes — your API is handling requests but 15% are failing. No threshold monitor catches this unless you've built one
- Silent endpoint failures — a specific endpoint that should receive traffic has gone quiet. An uptime check can't detect the absence of expected requests
- Gradual degradation — response times creep up 10ms per hour over 24 hours. No single spike triggers an alert, but your API is now 10x slower than yesterday
Real API monitoring covers all of these.
The Four Metrics That Matter
1. Uptime
The baseline. Is your API responding at all?
What to measure: HTTP status code returned from a synthetic request to your API's health endpoint every 1–5 minutes.
What to alert on:
- Non-2xx response from health endpoint
- No response within timeout threshold (e.g. 10 seconds)
- SSL certificate expiry within 14 days
What uptime monitoring misses: everything below.
2. Response Time
How long does your API take to respond? This is often the first signal of a problem — response times degrade before errors spike.
What to measure:
- p50 (median) — typical experience for most users
- p95 — experience for the slowest 5% of requests
- p99 — experience for the slowest 1% — often where timeouts live
What to alert on:
- p95 response time exceeds threshold (e.g. > 2 seconds)
- p95 response time increases > 50% compared to rolling baseline
- Any endpoint exceeds its SLA response time
The baseline problem: a fixed threshold (alert if > 2s) misses relative degradation. An endpoint that normally responds in 50ms but suddenly takes 800ms has degraded 16x — but never crosses a 2-second threshold. Smart Silence Detection learns your baseline automatically and alerts on anomalous degradation regardless of the absolute value.
3. Error Rate
What percentage of requests are failing?
What to measure:
- 4xx rate (client errors — bad requests, auth failures, not found)
- 5xx rate (server errors — the ones that matter most)
- Error rate per endpoint, not just globally
What to alert on:
- 5xx rate exceeds threshold (e.g. > 1% over 5 minutes)
- 5xx rate spikes > 3x compared to baseline
- A specific endpoint's error rate exceeds threshold while global rate looks normal
The per-endpoint blind spot: a global error rate of 0.5% looks healthy. But if /api/checkout has a 30% error rate and /api/ping has 0%, your global average hides the real problem. Monitor per endpoint, not just globally.
4. Traffic Volume (Silence Alerts)
Is your API receiving the traffic it should?
This is the metric most teams skip — and the one that catches the failures uptime checks structurally cannot.
What to measure: request count per endpoint per time window, compared to expected baseline.
What to alert on:
- No requests to a critical endpoint in X time (silence alert)
- Request volume drops > 40% compared to baseline (anomaly)
- A high-traffic endpoint goes completely quiet
Examples of what silence alerts catch:
- Your payment webhook endpoint stops receiving Stripe events — Stripe is retrying to a broken URL
- Your mobile app stops calling
/api/sync— a new app version broke the integration - Your data pipeline stops hitting
/api/ingest— the upstream job silently failed
Setting Up API Monitoring With NotiLens
Install the SDK
pip install notilens        # Python
npm install @notilens/notilens  # Node.js
Initialise
import notilens

nl = notilens.init(
    name="api-monitor",
    token="YOUR_TOKEN",   # or set NOTILENS_TOKEN env var
    secret="YOUR_SECRET"  # or set NOTILENS_SECRET env var
)
Instrumenting Your API Endpoints
The most effective approach: add NotiLens tracking as middleware so every request is monitored automatically — no per-endpoint code changes.
FastAPI middleware:
import time
import notilens
from fastapi import FastAPI, Request
from starlette.middleware.base import BaseHTTPMiddleware

nl  = notilens.init(name="api-monitor")
app = FastAPI()

class NotiLensMiddleware(BaseHTTPMiddleware):
    async def dispatch(self, request: Request, call_next):
        start_ts = time.time()
        run = nl.task("api-request")
        run.start()

        try:
            response = await call_next(request)
            duration_ms = round((time.time() - start_ts) * 1000, 2)

            run.metric("response_time_ms", duration_ms)
            run.metric("status_code", response.status_code)

            if response.status_code >= 500:
                # ✦ 5xx — server error, alert immediately
                run.error(f"{request.method} {request.url.path} → {response.status_code} ({duration_ms}ms)")
            elif response.status_code >= 400:
                # 4xx — client error, track but don't alert by default
                run.track("api.4xx", f"{request.method} {request.url.path} → {response.status_code}")
                run.complete(f"{response.status_code} {duration_ms}ms")
            else:
                run.complete(f"{response.status_code} {duration_ms}ms")

            return response

        except Exception as e:
            run.fail(f"{request.method} {request.url.path} — unhandled: {str(e)}")
            raise

app.add_middleware(NotiLensMiddleware)
Express.js middleware:
import { NotiLens } from '@notilens/notilens';

const nl = NotiLens.init('api-monitor');

export function notilensMiddleware(req, res, next) {
  const run    = nl.task('api-request');
  const startTs = Date.now();

  run.start();

  res.on('finish', () => {
    const durationMs = Date.now() - startTs;
    run.metric('response_time_ms', durationMs);
    run.metric('status_code', res.statusCode);

    if (res.statusCode >= 500) {
      // ✦ 5xx — server error, alert immediately
      run.error(`${req.method} ${req.path} → ${res.statusCode} (${durationMs}ms)`);
    } else {
      run.complete(`${res.statusCode} ${durationMs}ms`);
    }
  });

  res.on('error', (err) => {
    run.fail(`${req.method} ${req.path} — ${err.message}`);
  });

  next();
}
Monitoring Specific Critical Endpoints
For high-value endpoints — payments, auth, webhooks — add explicit monitoring on top of the middleware:
@app.post("/api/payments")
async def process_payment(payload: PaymentPayload):
    run = nl.task("payment-endpoint")
    run.start()

    try:
        result = await payment_processor.charge(payload)

        run.metric("amount_usd", payload.amount / 100)
        run.output_generated(f"Payment {result.id} processed")
        run.complete("Payment successful")
        return result

    except PaymentDeclinedError as e:
        # Expected failure — track but don't page on-call
        run.track("payment.declined", str(e), meta={"reason": e.decline_code})
        run.complete("Payment declined")
        raise HTTPException(status_code=402, detail=str(e))

    except Exception as e:
        # Unexpected failure — alert immediately
        run.fail(f"Payment processing error: {str(e)}")
        raise HTTPException(status_code=500, detail="Payment processing failed")
Setting Up Synthetic Uptime Checks
In addition to real-traffic monitoring, run synthetic checks — scheduled requests that test your API is alive even during low-traffic periods:
import notilens
import httpx
import asyncio

nl = notilens.init(name="api-uptime")

ENDPOINTS_TO_CHECK = [
    {"name": "health",    "url": "https://api.yourapp.com/health",        "method": "GET",  "expected_status": 200, "timeout_ms": 5000},
    {"name": "auth",      "url": "https://api.yourapp.com/api/auth/ping", "method": "GET",  "expected_status": 200, "timeout_ms": 3000},
    {"name": "payments",  "url": "https://api.yourapp.com/api/payments",  "method": "POST", "expected_status": 405, "timeout_ms": 3000},
]

async def check_endpoint(endpoint: dict):
    run = nl.task(f"uptime-{endpoint['name']}")
    run.start()

    try:
        start_ts = asyncio.get_event_loop().time()
        async with httpx.AsyncClient(timeout=endpoint["timeout_ms"] / 1000) as client:
            response = await client.request(endpoint["method"], endpoint["url"])
        duration_ms = round((asyncio.get_event_loop().time() - start_ts) * 1000, 2)

        run.metric("response_time_ms", duration_ms)
        run.metric("status_code", response.status_code)

        if response.status_code != endpoint["expected_status"]:
            run.fail(
                f"{endpoint['name']} returned {response.status_code}, "
                f"expected {endpoint['expected_status']} ({duration_ms}ms)"
            )
        else:
            run.complete(f"{response.status_code} {duration_ms}ms")

    except httpx.TimeoutException:
        run.timeout(f"{endpoint['name']} timed out after {endpoint['timeout_ms']}ms")
    except Exception as e:
        run.fail(f"{endpoint['name']} check failed: {str(e)}")

async def run_all_checks():
    await asyncio.gather(*[check_endpoint(ep) for ep in ENDPOINTS_TO_CHECK])

# Run every 2 minutes via cron or APScheduler
if __name__ == "__main__":
    asyncio.run(run_all_checks())
Silence Alerts for Critical Endpoints
The middleware above tracks active requests. Silence alerts catch when traffic stops entirely:
For each critical endpoint, create a dedicated NotiLens topic and send a ping on every successful request. Smart Silence Detection learns the normal traffic pattern and alerts when the endpoint goes abnormally quiet:
# Dedicated silence monitor for your payment webhook endpoint
payment_webhook_monitor = notilens.init(name="stripe-webhook-traffic")

@app.post("/webhooks/stripe")
async def stripe_webhook(request: Request):
    # ... your webhook handling logic ...

    # ✦ Ping NotiLens — confirms webhook traffic is flowing
    webhook_run = payment_webhook_monitor.task("webhook-received")
    webhook_run.start()
    webhook_run.complete("Webhook processed")
    # Smart Silence Detection alerts if this endpoint goes quiet
What to Alert On — The Full Matrix
| Condition | Severity |
|---|---|
| Health endpoint returning non-2xx | 🔴 Critical |
| 5xx error rate > 1% over 5 min | 🔴 Critical |
| 5xx error rate > 5% over 1 min | 🔴 Critical |
| p95 response time > 3x baseline | 🟠 Warning |
| p99 response time > 10 seconds | 🔴 Critical |
| Critical endpoint no traffic in 30 min | 🔴 Critical |
| Global error rate > 0.5% above baseline | 🟠 Warning |
| Single endpoint error rate > 10% | 🔴 Critical |
| Response time creeping (anomaly) | 🟠 Warning |
API Monitoring Checklist
Before you consider an API properly monitored:
- Health endpoint checked every 1–5 minutes (uptime)
- Middleware tracking response time and status code on every request
- 5xx errors trigger immediate alert via
run.error()orrun.fail() - p95 / p99 response time tracked via
run.metric("response_time_ms", ...) - Smart Silence Detection active on critical endpoints
- Payment, auth, and webhook endpoints monitored individually
- Synthetic uptime checks running on a cron schedule
- SSL expiry alert configured
- On-call schedule set for critical alerts
- Escalation policy defined if on-call doesn't acknowledge within 10 minutes
- Tested — deliberately triggered a 500 and confirmed alert fired
API monitoring is Layer 3 of a complete founder stack — see The Founder's Monitoring Stack for how it fits alongside revenue and silence monitoring.
Summary
Uptime monitoring is the floor, not the ceiling, of API observability. A green uptime dashboard while your checkout endpoint silently returns 500s for 12% of requests is not monitoring — it's false confidence.
Real API monitoring covers uptime, response time degradation, error rate spikes, and silence alerts for endpoints that should be receiving traffic but aren't. Together these four layers catch the failures that actually cost you users and revenue.
NotiLens covers all four — without an enterprise observability budget.
Try NotiLens free for 7 days — no credit card required.
Frequently Asked Questions
What's the difference between API monitoring and APM (Application Performance Monitoring)? APM tools like Datadog or New Relic provide deep traces of every function call, database query, and network hop inside your application. API monitoring focuses on the observable behaviour of your API from the outside — uptime, response time, error rates. APM is more powerful but requires significant instrumentation and cost. API monitoring with NotiLens gives you the alerts that matter most in under 10 minutes.
Should I monitor every endpoint or just critical ones? Start with critical ones: health, auth, payments, webhooks, and any endpoint your core user flows depend on. Add middleware to monitor all endpoints passively (response time, error rate) without per-endpoint effort. Use dedicated silence monitoring for endpoints that should always be receiving traffic.
What's a good p95 response time target? It depends on your use case. For synchronous user-facing APIs: < 500ms is good, < 200ms is excellent. For async or batch APIs: thresholds can be looser. The more important metric is relative: if your p95 doubles overnight, that's a problem regardless of the absolute number. Smart Silence Detection handles relative baseline alerting automatically.
How do I avoid alert fatigue from high-traffic APIs?
Use run.error() only for 5xx errors — not 4xx. Set error rate thresholds rather than alerting on every single error (e.g. alert if 5xx rate > 1% over 5 minutes, not on each individual 500). Use NotiLens's noise filtering so brief transient spikes don't page your on-call engineer at 3am.
Can I monitor third-party APIs my application depends on? Yes. Use the synthetic uptime check pattern — run a scheduled request to the third-party API endpoint and track response time and status. If Stripe's API, your payment processor, or any external dependency starts degrading, you'll know before your users do.
What's the difference between monitoring your API and monitoring your infrastructure? Infrastructure monitoring (CPU, memory, disk, network) tells you about your server's health. API monitoring tells you about your application's behaviour. Both matter but they catch different failures. A server with healthy CPU can still have a broken API endpoint. An API with perfect response times can still be running on a server that's about to run out of disk space. Monitor both.